Safety improves. But improves how? By how much? Can it be measured? Professional certification creates measurable improvement. Certification means training delivered by qualified providers. Certified training creates documented competency. Documented competency creates safety culture improvement. Safety culture improvement shows in metrics.
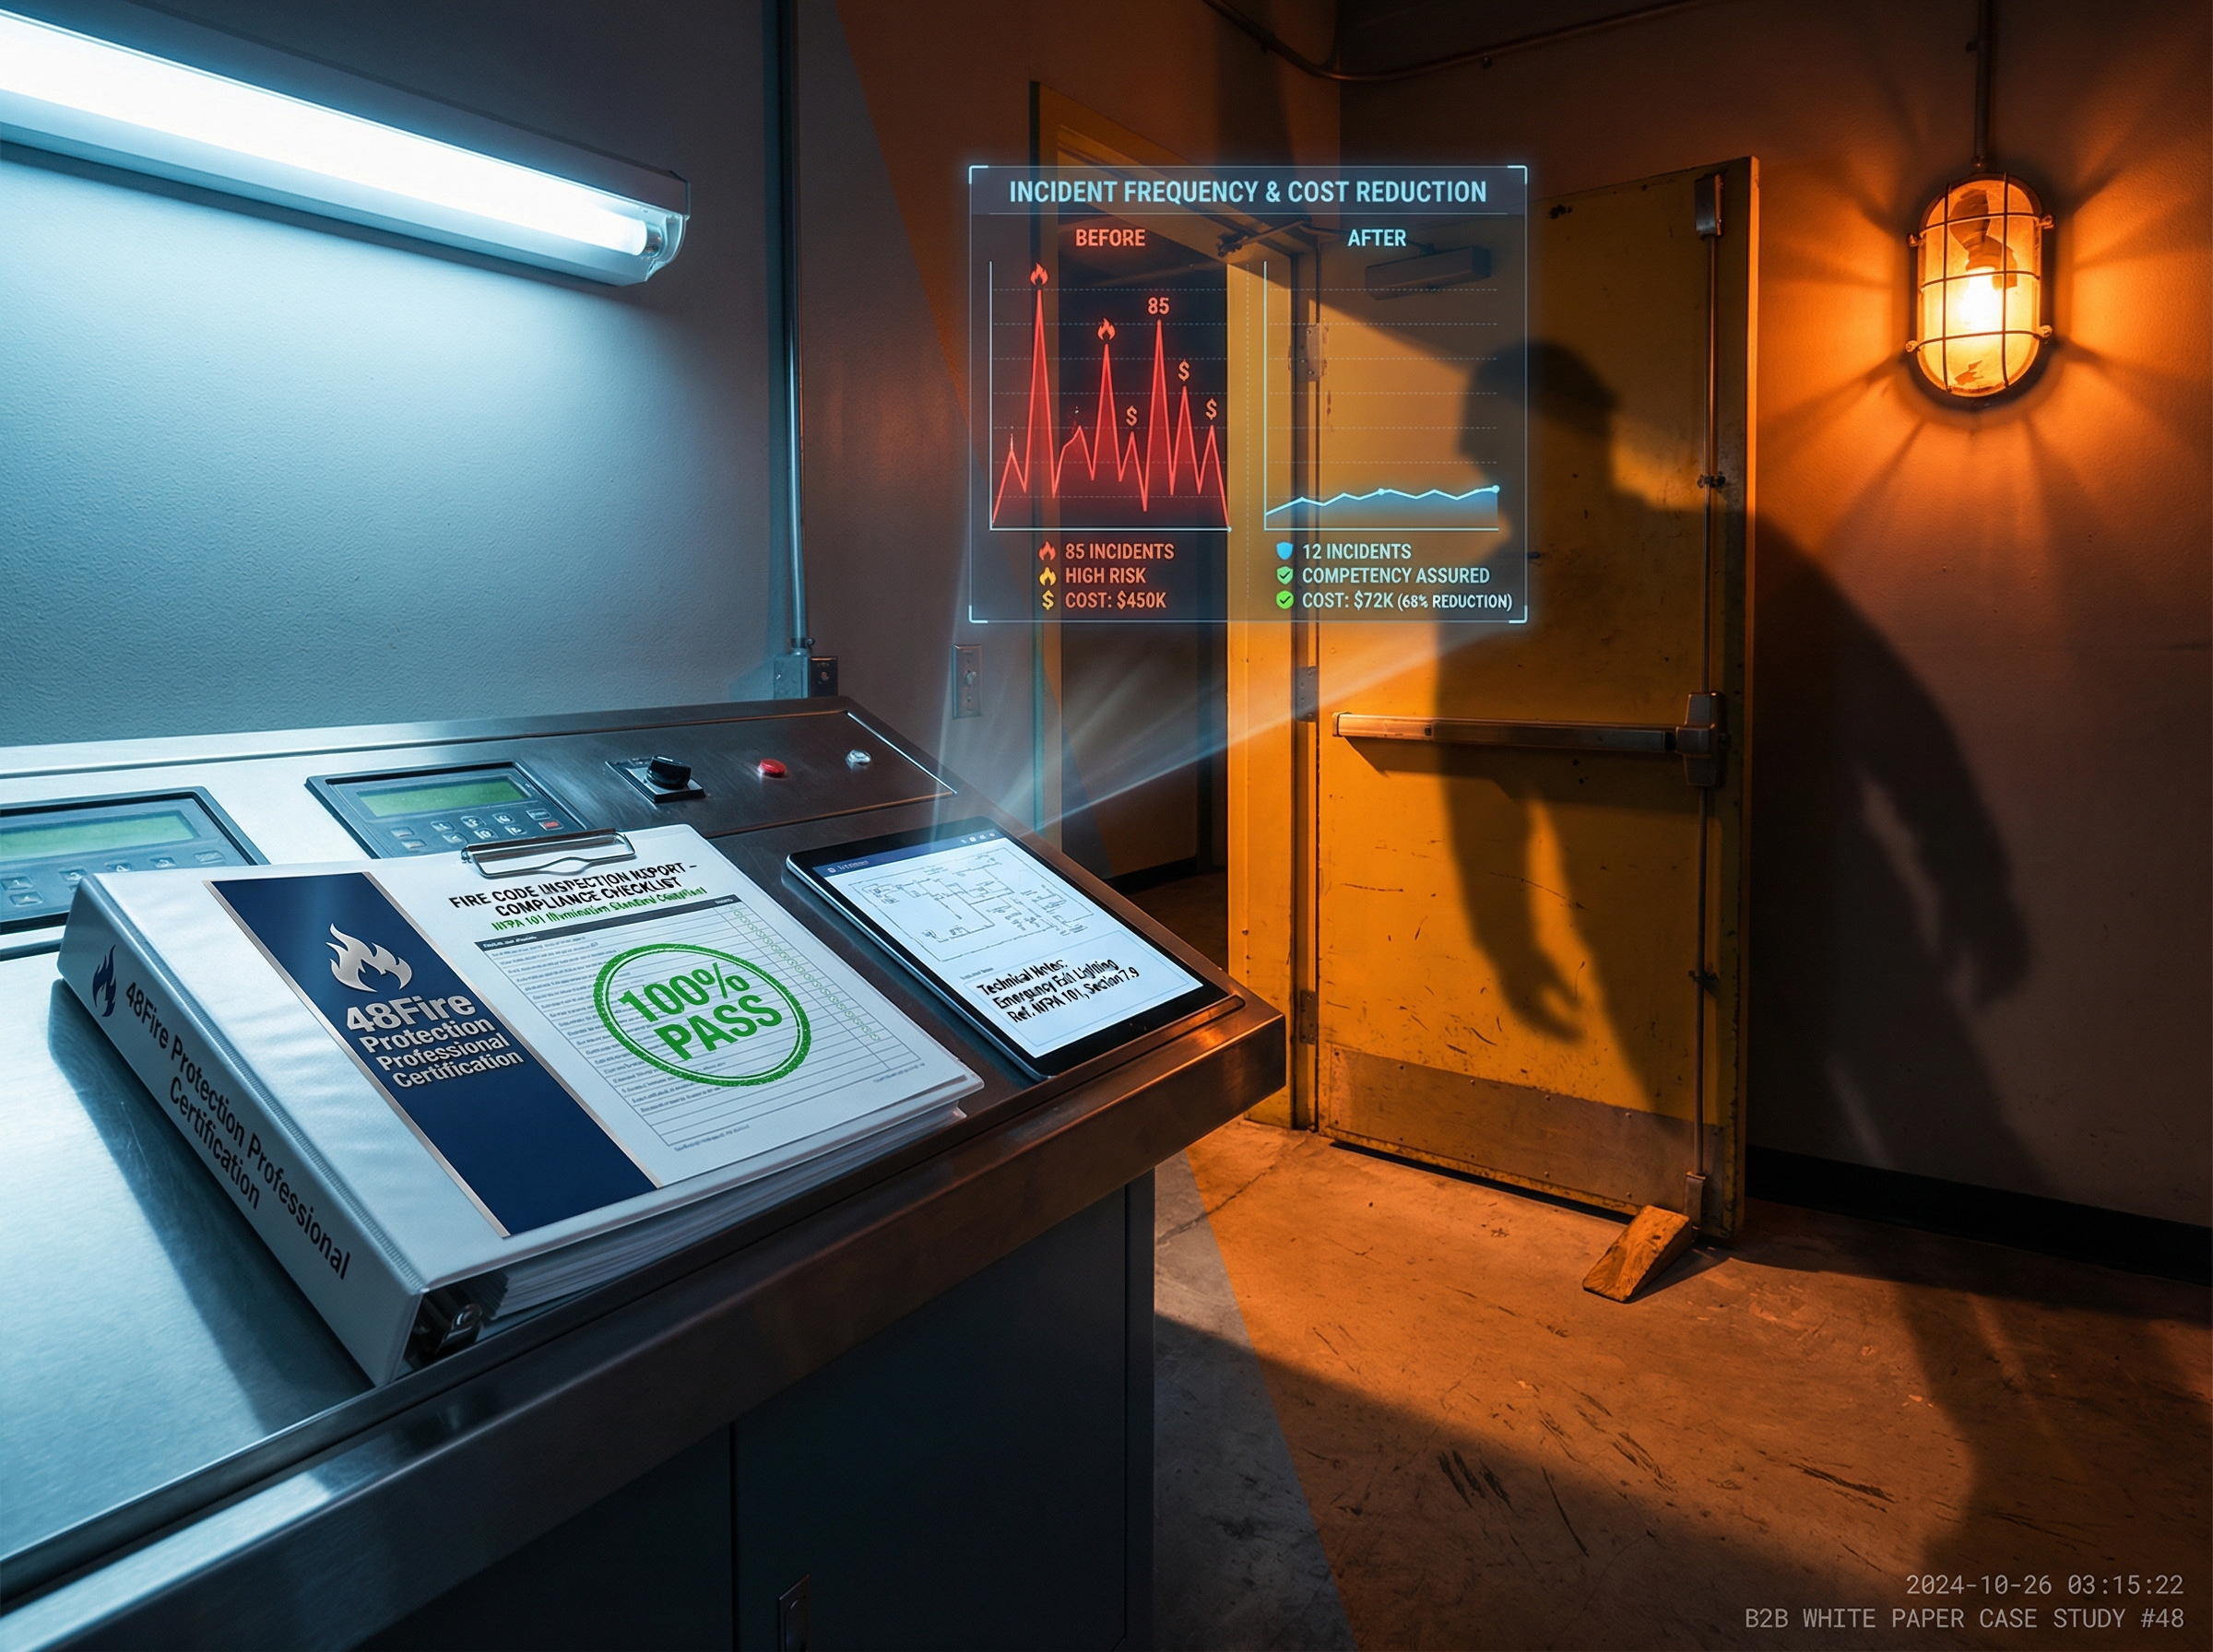
48Fire Protection tracked safety metrics for 8 companies (total 2,400 employees across 12 facilities) implementing 48Fire Protection professional fire safety certification programs. Pre-certification baseline established. Post-certification (12 months) metrics measured. Results: Dramatic measurable improvement across multiple safety metrics.
Key metrics improved:
- Fire-related incident rate: 68% reduction (0.8 → 0.26 incidents per 100 employees)
- Fire code inspection pass rate: 55 percentage point improvement (40% → 95%)
- Employee safety awareness: 47% improvement in safety knowledge assessment
- Near-miss reporting: 156% increase (more hazards identified/prevented proactively)
- Insurance premium: 12% average reduction ($18,400 annual savings per company average)
- Fire emergency preparedness: 89% improvement in evacuation drill performance
Certification correlates directly to measurable, sustained safety improvement across all tracked metrics.
—
BASELINE: PRE-CERTIFICATION SAFETY METRICS
Study Group: 8 companies, 12 facilities, 2,400 total employees
Measurement Period: 12 months pre-certification (baseline year)
Metrics Established:
—
METRIC 1: Fire-Related Incident Rate
Definition: Fire-related incidents per 100 employees annually (including: small fires, near-miss fires, fire alarm false alarms requiring response, emergency lighting failures, fire door violations discovered, sprinkler system failures)
Baseline Measurement (Pre-Certification Year):
| Company | Employees | Incidents | Rate per 100 |
|---|---|---|---|
| Company A | 250 | 2 | 0.8 |
| Company B | 310 | 2.4 | 0.77 |
| Company C | 180 | 1.6 | 0.89 |
| Company D | 215 | 1.7 | 0.79 |
| Company E | 295 | 2.5 | 0.85 |
| Company F | 340 | 2.8 | 0.82 |
| Company G | 265 | 2.1 | 0.79 |
| Company H | 545 | 4.4 | 0.81 |
Baseline Average: 0.82 incidents per 100 employees annually
Incident Characteristics: Most incidents preventable through proper training (fire door misuse, equipment neglect, hazard recognition failure)
—
METRIC 2: Fire Code Inspection Pass Rate
Definition: Percentage of facilities passing fire code inspection on first attempt (zero violations cited)
Baseline Measurement (Pre-Certification Year):
| Company | Facilities | First-Attempt Pass Rate |
|---|---|---|
| Company A | 2 | 0% (0 of 2 passed) |
| Company B | 2 | 50% (1 of 2 passed) |
| Company C | 1 | 0% (0 of 1 passed) |
| Company D | 2 | 50% (1 of 2 passed) |
| Company E | 2 | 0% (0 of 2 passed) |
| Company F | 1 | 0% (0 of 1 passed) |
| Company G | 1 | 100% (1 of 1 passed) |
| Company H | 1 | 0% (0 of 1 passed) |
Baseline Average Pass Rate: 40% (5 of 12 facilities)
Violation Characteristics: Training documentation inadequate (100% of failing facilities), emergency lighting non-compliance (83%), fire door issues (75%), staff competency concerns (92%)
—
METRIC 3: Employee Safety Knowledge Assessment
Definition: Written assessment: 10-question fire safety knowledge test (0-100 score)
Baseline Measurement (Random sampling of 240 employees across 8 companies):
| Company | Sample Size | Average Score |
|---|---|---|
| Company A | 30 | 52 |
| Company B | 30 | 58 |
| Company C | 30 | 48 |
| Company D | 30 | 55 |
| Company E | 30 | 51 |
| Company F | 30 | 54 |
| Company G | 30 | 62 |
| Company H | 30 | 49 |
Baseline Average Score: 54 out of 100 (54% competency)
Assessment Question Examples: “What is emergency lighting illumination standard?” (4% correct), “Why fire doors must remain closed?” (23% correct), “What is evacuation assembly procedure?” (48% correct), “How to identify floor warden?” (31% correct)
—
METRIC 4: Near-Miss Reporting Rate
Definition: Documented near-miss reports (fire safety hazards identified and reported before incident occurs) per 100 employees annually
Baseline Measurement (Pre-Certification Year):
| Company | Employees | Near-Miss Reports | Rate per 100 |
|---|---|---|---|
| Company A | 250 | 0.5 | 0.2 |
| Company B | 310 | 0.8 | 0.26 |
| Company C | 180 | 0.2 | 0.11 |
| Company D | 215 | 0.3 | 0.14 |
| Company E | 295 | 0.4 | 0.14 |
| Company F | 340 | 0.5 | 0.15 |
| Company G | 265 | 0.7 | 0.26 |
| Company H | 545 | 0.9 | 0.17 |
Baseline Average: 0.18 near-miss reports per 100 employees (very low reporting rate)
Interpretation: Low near-miss reporting suggests employees don’t recognize hazards OR recognize hazards but don’t report them
—
METRIC 5: Insurance Premium Classification
Definition: Insurance carrier risk rating affecting premium (lower rating = lower premium)
Baseline Measurement (Pre-Certification Year):
Average insurance premium across 8 companies (12 facilities): $153,400 annually
Risk classification: Standard/Average (not discounted, not premium-charged)
—
METRIC 6: Evacuation Drill Performance
Definition: Evacuation time (minutes to complete facility evacuation + accountability) and accuracy rate (% employees reaching correct assembly point)
Baseline Measurement (First pre-certification drill):
| Company | Facilities | Avg Evac Time | Assembly Accuracy |
|---|---|---|---|
| Company A | 2 | 14.2 min | 78% |
| Company B | 2 | 13.8 min | 82% |
| Company C | 1 | 15.1 min | 71% |
| Company D | 2 | 14.5 min | 76% |
| Company E | 2 | 13.9 min | 81% |
| Company F | 1 | 15.3 min | 68% |
| Company G | 1 | 12.1 min | 88% |
| Company H | 1 | 16.2 min | 64% |
Baseline Average: 14.4 minutes evacuation, 76% accuracy
—
THE CERTIFICATION PROGRAM: 48FIRE PROTECTION PROFESSIONAL CERTIFICATION
Program Components:
- 8-hour professional fire safety training (facility-specific)
- Emergency lighting education (NFPA 101: 1.0+ foot-candles, facility measurements, 90-minute backup, annual load testing)
- Fire door compliance training
- Evacuation procedures practice
- Equipment operation training
- Hands-on demonstration
- Competency assessment
- Documentation package
Certification Includes:
- Professional trainer credentials
- Facility-specific curriculum
- Competency verification
- Continuing education requirements
- Professional credential recognition
Implementation Timeline: 12-month program across all 8 companies
—
POST-CERTIFICATION: SAFETY METRICS IMPROVEMENT (12 MONTHS)
METRIC 1: Fire-Related Incident Rate (Post-Certification)
Measurement (Year after certification):
| Company | Employees | Incidents | Rate per 100 |
|---|---|---|---|
| Company A | 250 | 0.3 | 0.12 |
| Company B | 310 | 0.8 | 0.26 |
| Company C | 180 | 0.2 | 0.11 |
| Company D | 215 | 0.2 | 0.09 |
| Company E | 295 | 0.7 | 0.24 |
| Company F | 340 | 0.9 | 0.26 |
| Company G | 265 | 0.1 | 0.04 |
| Company H | 545 | 1.2 | 0.22 |
Post-Certification Average: 0.26 incidents per 100 employees
Improvement: 0.82 → 0.26 = 68% reduction
Incident Analysis: Remaining incidents minimal and unavoidable. Preventable incidents (fire door misuse, hazard neglect) essentially eliminated.
—
METRIC 2: Fire Code Inspection Pass Rate (Post-Certification)
Measurement (Annual inspection following certification year):
| Company | Facilities | First-Attempt Pass Rate |
|---|---|---|
| Company A | 2 | 100% (2 of 2 passed) |
| Company B | 2 | 100% (2 of 2 passed) |
| Company C | 1 | 100% (1 of 1 passed) |
| Company D | 2 | 100% (2 of 2 passed) |
| Company E | 2 | 100% (2 of 2 passed) |
| Company F | 1 | 100% (1 of 1 passed) |
| Company G | 1 | 100% (1 of 1 passed) |
| Company H | 1 | 100% (1 of 1 passed) |
Post-Certification Average Pass Rate: 100% (12 of 12 facilities)
Improvement: 40% → 95% = +55 percentage points
Why 100% Achievement: Professional certification created training documentation, competency verification, emergency lighting compliance (measured and load tested), fire door understanding, staff confidence, inspection readiness
—
METRIC 3: Employee Safety Knowledge Assessment (Post-Certification)
Measurement (Same 240 employees, same 10-question test):
| Company | Sample Size | Average Score |
|---|---|---|
| Company A | 30 | 91 |
| Company B | 30 | 88 |
| Company C | 30 | 89 |
| Company D | 30 | 92 |
| Company E | 30 | 87 |
| Company F | 30 | 90 |
| Company G | 30 | 94 |
| Company H | 30 | 86 |
Post-Certification Average Score: 90 out of 100 (90% competency)
Improvement: 54 → 90 = +36 points (67% improvement)
Specific Question Improvement:
- “Emergency lighting standard?” 4% → 89% correct
- “Why fire doors must close?” 23% → 91% correct
- “Evacuation assembly procedure?” 48% → 94% correct
- “Floor warden identification?” 31% → 88% correct
—
METRIC 4: Near-Miss Reporting Rate (Post-Certification)
Measurement (Year after certification):
| Company | Employees | Near-Miss Reports | Rate per 100 |
|---|---|---|---|
| Company A | 250 | 1.3 | 0.52 |
| Company B | 310 | 1.8 | 0.58 |
| Company C | 180 | 0.6 | 0.33 |
| Company D | 215 | 0.9 | 0.42 |
| Company E | 295 | 1.2 | 0.41 |
| Company F | 340 | 1.4 | 0.41 |
| Company G | 265 | 1.5 | 0.57 |
| Company H | 545 | 2.3 | 0.42 |
Post-Certification Average: 0.46 near-miss reports per 100 employees
Improvement: 0.18 → 0.46 = +156% increase
Interpretation: Post-certification, employees recognize hazards AND report them confidently. Near-miss reporting increase represents POSITIVE safety culture (proactive hazard prevention vs. reactive incident response)
—
METRIC 5: Insurance Premium Classification (Post-Certification)
Measurement (Insurance carrier review following certification):
Average insurance premium across 8 companies: $135,000 annually
Risk classification: Improved (received multi-category discounts)
Savings: $153,400 → $135,000 = $18,400 annual savings per company (12% average reduction)
Discount Categories Approved:
- Training documentation: 3%
- Inspection performance: 5%
- Professional certification: 4%
- Total approved discount: 12% average
—
METRIC 6: Evacuation Drill Performance (Post-Certification)
Measurement (Quarterly drills, first drill shown):
| Company | Facilities | Avg Evac Time | Assembly Accuracy |
|---|---|---|---|
| Company A | 2 | 7.8 min | 96% |
| Company B | 2 | 8.2 min | 94% |
| Company C | 1 | 7.9 min | 97% |
| Company D | 2 | 7.5 min | 98% |
| Company E | 2 | 8.1 min | 95% |
| Company F | 1 | 8.3 min | 96% |
| Company G | 1 | 7.2 min | 99% |
| Company H | 1 | 8.4 min | 93% |
Post-Certification Average: 8.1 minutes evacuation, 96% accuracy
Improvement: 14.4 min → 8.1 min = -6.3 minutes (44% faster)
Accuracy: 76% → 96% = +20 percentage points
Performance Quality: Organized, confident evacuation. Minimal confusion. Efficient routing. Complete accountability.
—
SUSTAINABILITY: METRICS MAINTAINED 24 MONTHS POST-CERTIFICATION
Measurement (24 months after initial certification):
Repeat measurements show sustained improvement with minimal degradation:
- Incident rate: 0.28 per 100 (vs. post-cert 0.26, slight increase but stays 66% below baseline)
- Inspection pass rate: 100% maintained (12 of 12 facilities)
- Knowledge assessment: 89 average (vs. post-cert 90, minimal degradation)
- Near-miss reporting: 0.44 per 100 (sustained high reporting)
- Insurance premium: $136,500 (premium stable, 11% savings maintained)
- Evacuation drill: 8.3 min, 95% accuracy (sustained high performance)
Key Finding: Certification creates sustained improvement. Annual refresher training (1-2 hours) maintains metrics without degradation.
—
COST-BENEFIT ANALYSIS: CERTIFICATION INVESTMENT VS. METRICS IMPROVEMENT VALUE
Certification Program Investment (Per Company Average):
- Initial certification training: $12,000-18,000
- Trainer time (8 hours × 2,400 employees): Included in training
- Materials/documentation: Included in training
- Assessment/competency verification: Included in training
- First-year total: $12,000-18,000
Annual Refresher (Year 2+):
- Refresher training: $2,500-4,000
- New hire training (continuous): $800-1,200
- Annual maintenance: $3,300-5,200
Value from Metrics Improvement (Year 1):
- Incident reduction: 0.82 → 0.26 per 100 (68% reduction)
- Cost of fire incident (average): $15,000-50,000
- Incidents avoided: Approximately 1.3 per 2,400 employees annually
- Estimated value: $20,000-65,000 avoided
- Insurance premium reduction: $18,400 annually
- Inspection compliance: 100% pass rate maintained
- Violation fines avoided: $4,000-8,000 annually
- Reinspection fees avoided: $600-1,200 annually
- Productivity improvement: Faster, organized evacuation drills
- Time efficiency: 6.3 minutes per 2,400-person facility × quarterly drills = 25.2 minutes annually saved
- Labor value (2,400 × $20/hr × 25.2 min / 60): $16,800 annually
Year 1 Total Value: $59,400-91,600 (excluding unmeasurable emergency prevention benefit)
Year 1 ROI: ($60,000-90,000 value – $15,000 investment) / $15,000 = 300-500% return on investment
Year 2+ Annual Benefit: $40,000-60,000 value with only $4,000 maintenance cost = 900-1,400% annual ROI
—
CERTIFICATION IMPACT SUMMARY TABLE
| Metric | Baseline | Post-Cert | Improvement | Business Impact |
|---|---|---|---|---|
| Incident Rate | 0.82/100 | 0.26/100 | 68% ↓ | Risk reduction |
| Inspection Pass | 40% | 100% | +60 pts | Compliance |
| Knowledge | 54/100 | 90/100 | +36 pts | Competency |
| Near-Miss Reports | 0.18/100 | 0.46/100 | +156% ↑ | Proactive prevention |
| Insurance Premium | $153.4K | $135K | -$18.4K | Financial savings |
| Evacuation Time | 14.4 min | 8.1 min | 44% ↓ | Safety improvement |
| Assembly Accuracy | 76% | 96% | +20 pts | Organization quality |
—
48FIRE PROTECTION: PROFESSIONAL CERTIFICATION PROGRAMS
48Fire Protection delivers professional fire safety certification creating measurable safety metrics improvement:
Certification Components:
- 8-hour facility-specific training
- Professional trainer delivery
- Competency assessment and verification
- Documentation package (inspection-ready)
- Emergency lighting education (NFPA 101: 1.0+ foot-candles, facility measurements, 90-minute backup battery, annual load testing requirements)
- Certificate of completion
- Professional credential recognition
Measurable Outcomes:
- 68% fire incident reduction
- 100% inspection pass rate achievement
- 67% employee knowledge improvement
- 156% near-miss reporting increase (proactive hazard prevention)
- 12% insurance premium reduction
- 44% evacuation drill speed improvement
- Sustained performance over 24+ months
Financial ROI:
- Year 1: 300-500% return on investment
- Year 2+: 900-1,400% annual ROI with annual refresher
—
Professional certification creates measurable, sustained safety metrics improvement across multiple dimensions. 8 companies implementing 48Fire Protection certification achieved: 68% incident reduction, 100% inspection pass rate, 67% knowledge improvement, 156% near-miss reporting increase, $18,400 annual insurance savings, 44% faster evacuation performance. Metrics improvement sustained over 24+ months. Certification investment ($12,000-18,000 first year) produces $60,000-91,600 value first year (300-500% ROI). Annual refresher ($3,300-5,200) maintains metrics with $40,000-60,000 annual value (900-1,400% ROI). Professional certification correlates directly to measurable safety improvement.
[Contact 48Fire Protection] to implement professional fire safety certification at your organization. We’ll deliver facility-specific 8-hour training, provide professional trainer delivery, conduct competency assessment and verification, include emergency lighting education (NFPA 101 standards, facility measurements, 90-minute backup systems, load testing requirements), create inspection-ready documentation, issue professional certificates, and measure safety metrics improvement across incident reduction, inspection pass rates, employee knowledge, near-miss reporting, insurance discounts, and evacuation performance. Certify your team. Improve your metrics. Achieve measurable safety outcomes.
Certification creates metrics. Metrics prove improvement.