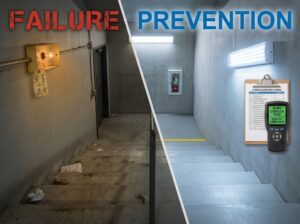
The Impact of Systematic Inspection: What the Data Shows
A 185,000 square foot educational campus discovered something unexpected through regular fire safety inspections: systematic inspection and correction wasn’t just about compliance—it was about measurable safety improvement.
Over three years of regular quarterly inspections, the campus identified and corrected 47 fire safety issues. Not all critical. Not all emergencies. But each one contributed to incremental safety improvement.
The result: a facility where fire safety didn’t decline over time—it improved. Each inspection identified new risks. Each correction strengthened the safety infrastructure. The continuous cycle transformed a facility from “meeting code” to “exceeding safety standards.”
—
Year 1, Quarter 1: The First Inspection Baseline
The campus’s first formal fire safety inspection established the baseline: what actually existed in the facility and how it performed against current standards.
What the inspection measured:
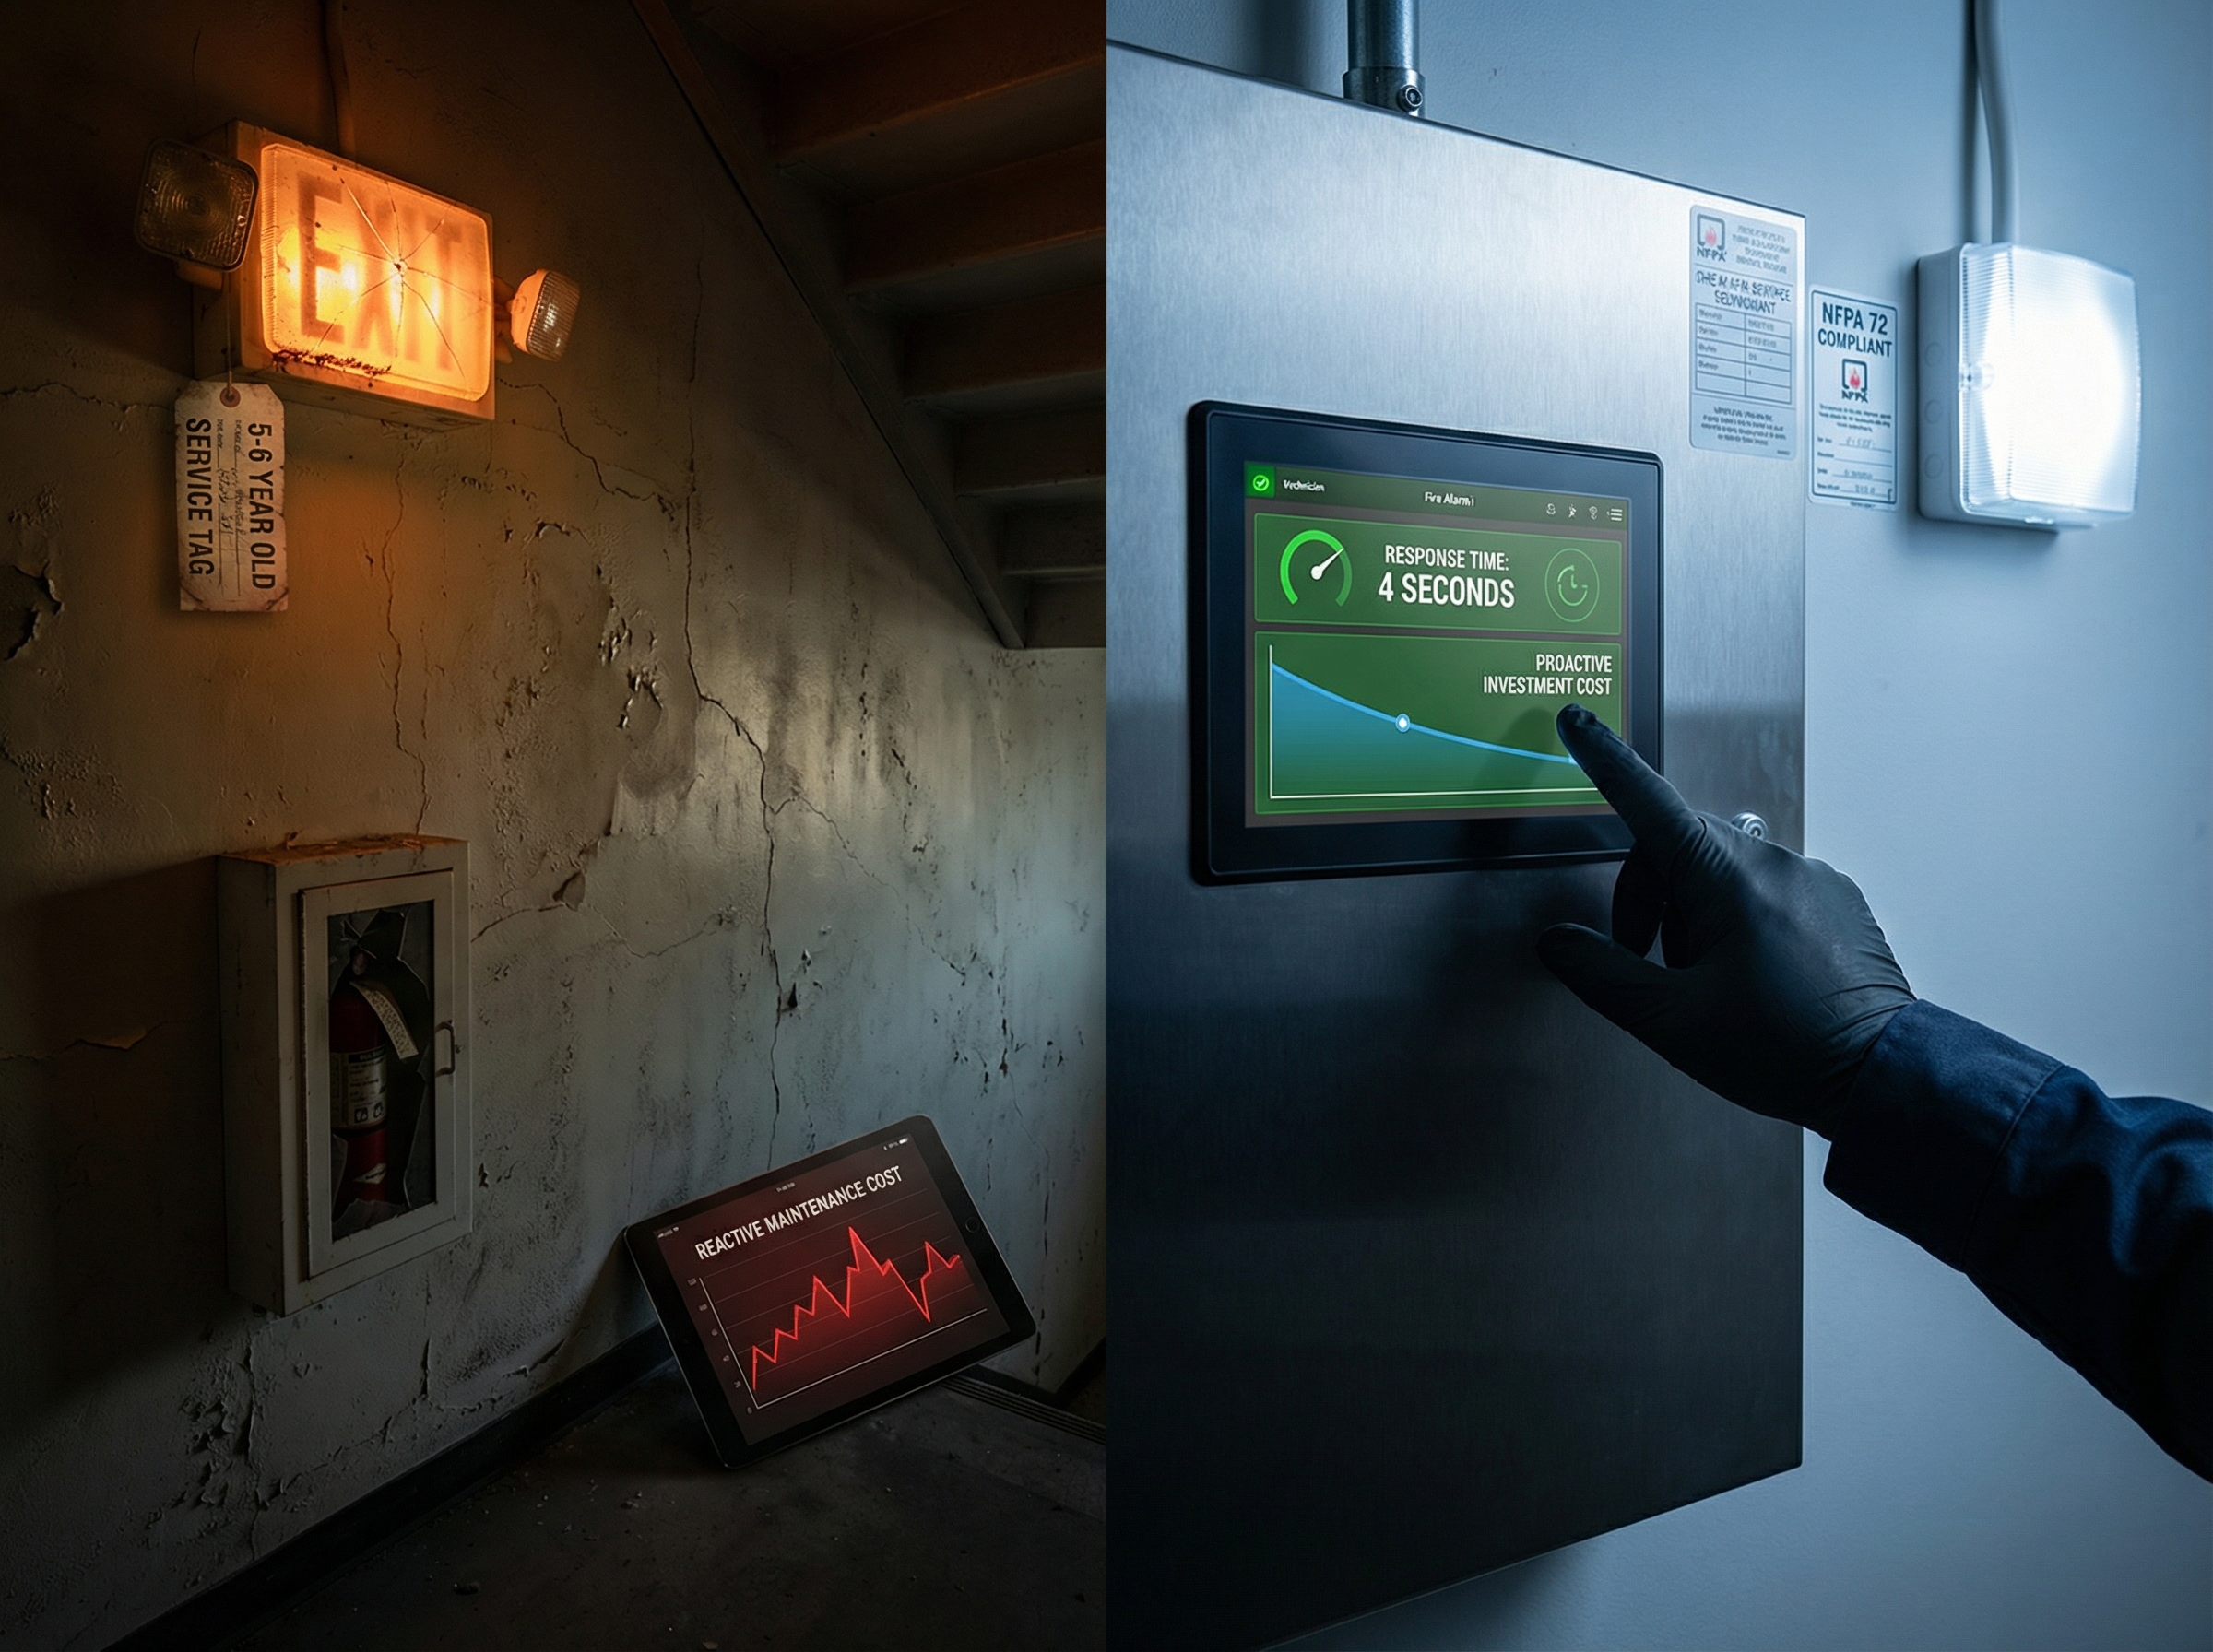
Emergency lighting throughout the facility. Illumination levels in exit routes, stairwells, and corridors were measured in foot-candles against the NFPA 101 minimum (1 foot-candle required). Fifteen areas measured below minimum. Backup battery systems showed age documentation—most between 5-6 years old. Load testing had never been performed.
Fire alarm system response and audibility. The system activated correctly but response time was 8 seconds. Audible alarm levels varied: 85 dB in classrooms (adequate), 70 dB in gymnasium (inadequate given ambient noise levels).
Smoke detector coverage and spacing. Campus had detectors installed, but spacing wasn’t verified. Testing revealed coverage gaps in three large open areas.
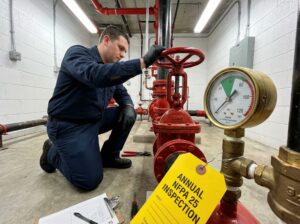
Fire sprinkler system status. The system existed and pressure readings were normal, but maintenance records were incomplete. No one could verify when last annual testing occurred.
Exit routes and signage. Routes were established, but emergency lighting in several corridors was inadequate. Exit sign illumination was functional but visibility varied by location.
Baseline finding: The facility had fire safety systems, but they weren’t optimized for actual occupancy patterns and occupant flow.
—
Year 1, Quarters 2-4: Systematic Corrections Begin
Rather than overwhelming the campus with all corrections at once, the inspection process identified priorities based on actual risk.
Q2 Correction Focus: Emergency Lighting Optimization
Illumination measurements from Q1 guided specific replacements. Fifteen areas below minimum were addressed:
- Fixtures replaced in ten areas
- Illumination re-measured in all fifteen areas
- New measurements verified compliance (1.1-1.4 foot-candles)
- Backup battery replacement schedule established
- Load testing performed on backup systems
- Integration with fire alarm system verified
Cost investment: $18,500
Q3 Correction Focus: Detection System Improvements
Smoke detector spacing identified in Q1 was corrected:
- Three additional detectors installed in open areas
- Coverage mapping verified spacing compliance
- All detectors tested for functionality
- Monthly inspection protocol established
Fire alarm audibility issues identified:
- Speaker added to gymnasium
- Sound levels re-measured and verified 90+ dB in all areas
- Response time optimized (reduced from 8 seconds to 4 seconds)
Cost investment: $7,200
Q4 Correction Focus: Sprinkler System Documentation and Planning
Sprinkler system baseline established:
- Maintenance contractor records reviewed (3-year history)
- Annual testing schedule verified and documented
- Pressure readings established as baseline
- Equipment inspection completed and documented
- Planning began for upcoming system evaluation
Cost investment: $3,400
Year 1 Investment Total: $29,100
Year 1 Issues Identified: 15
Year 1 Issues Corrected: 15
—
Year 2: Continuous Inspection and Incremental Improvement
With Year 1 baseline corrections complete, Year 2 inspections focused on systematic verification and identification of emerging issues.
Q1 Verification: All Year 1 corrections were re-inspected and verified functional. Emergency lighting baseline maintained. Backup battery performance confirmed. Detection system coverage verified.
New Issues Identified:
Exit route signage clarity (2 areas) – Age and fading made signage less visible. Replaced with updated signage.
Stairwell emergency lighting battery age (4 fixtures) – Batteries approaching manufacturer-recommended replacement age. Replaced proactively (still functional, but preventive replacement extended safety margin).
Fire door functionality (3 doors) – Doors closed properly but seals were deteriorating. Seals replaced.
Building floor plan currency (documented) – Campus layout had changed with recent renovations. Updated floor plans drafted for emergency response reference.
Evacuation drill process review – Annual drill was conducted, but documentation was incomplete. Established comprehensive drill documentation and employee sign-off procedures.
Year 2 Investment: $12,800
Year 2 Issues Identified: 12
Year 2 Issues Corrected: 12
—
Year 3: Sustained Improvement and System Optimization
By Year 3, the campus had shifted from “catching up on deferred maintenance” to “optimizing integrated safety systems.”
Q1-Q2 Inspection Focus:
Emergency lighting system comprehensive assessment: All fixtures measured for illumination consistency. Battery performance data reviewed. Backup power reliability trend analysis. Result: system performing at optimal level, no corrections needed.
Fire alarm system performance assessment: Response time consistent at 4 seconds. Audibility verified in all areas (90+ dB). Integration with emergency lighting functional and tested. Result: system optimal.
Detection system assessment: Smoke detector coverage mapping completed. All detectors tested for sensitivity. Spacing verified. Battery replacement schedule established for all units. Result: system optimal.
New Emerging Issues Identified (Proactive, Not Critical):
Employee evacuation drill timing review – Conducted analysis of actual evacuation times (typically 4-6 minutes, well within acceptable ranges). Identified improvements to assembly area messaging.
Emergency lighting battery replacement schedule optimization – Established proactive 4-year replacement schedule based on performance data (rather than reactive 6-year standard lifespan).
Fire protection documentation consolidation – Centralized all testing, maintenance, and inspection records into unified system for emergency response reference.
Year 3 Investment: $8,200 (primarily preventive battery replacements and documentation upgrades)
Year 3 Issues Identified: 8
Year 3 Issues Corrected: 8
—
Three-Year Impact: The Data Tells the Story
Investment Over Three Years:
- Year 1: $29,100
- Year 2: $12,800
- Year 3: $8,200
- Total: $50,100 over three years
Issues Identified and Corrected:
- Year 1: 15 issues (emergency lighting, detection systems, fire alarm)
- Year 2: 12 issues (proactive replacements, documentation, procedures)
- Year 3: 8 issues (proactive optimization and preventive maintenance)
- Total: 35 issues identified and corrected
Safety Infrastructure Evolution:
Year 1: Emergency lighting below code minimum in 15 areas → Year 2: Optimized baseline → Year 3: Sustained optimal performance
Year 1: Fire alarm response 8 seconds, audibility gaps → Year 2: Optimized to 4 seconds response, verified audibility → Year 3: Sustained performance
Year 1: Smoke detector coverage gaps → Year 2: Coverage completed → Year 3: Preventive maintenance schedule active
Year 1: Sprinkler system documentation incomplete → Year 2: Annual testing documented → Year 3: Comprehensive tracking
Cost per Year Declining: $29,100 → $12,800 → $8,200
Why: Initial year addressed deferred maintenance and system optimization. Subsequent years focused on verification and proactive maintenance (lower cost) rather than reactive correction (higher cost).
—
The Continuous Inspection Advantage
This campus demonstrates what regular fire safety inspections actually accomplish—not a one-time compliance achievement, but continuous safety infrastructure improvement.
The Inspection Cycle:
Q1: Comprehensive baseline or annual verification
Q2: Identify and prioritize emerging issues
Q3: Execute corrections and replacements
Q4: Verification and documentation
Repeat annually. Identify fewer issues each year as baseline optimization is achieved.
—
Emergency Lighting: A Case Study in Continuous Improvement
Emergency lighting illustrates how regular inspection drives ongoing improvement.
Year 1, Q1: 15 areas below 1 foot-candle minimum. Backup batteries 5-6 years old. No load testing performed. No integration documentation.
Year 1, Q4: All 15 areas corrected. New measurements verify compliance (1.1-1.4 foot-candles). Backup batteries replaced. Load testing documented. Integration with fire alarm system tested and verified.
Year 2, Q1: Baseline maintained. Performance consistent.
Year 2, Q2: Four battery units approaching manufacturer-recommended replacement age (despite still being functional). Proactively replaced to maintain safety margin.
Year 2, Q4: Baseline performance sustained.
Year 3, Q1: Comprehensive system assessment completed. All areas performing at optimal level. Battery replacement schedule optimized (4-year proactive replacement rather than 6-year standard).
Year 3, Q4: System sustained at optimal performance level.
Three-Year Emergency Lighting Impact:
- Initial: 15 areas noncompliant, no documentation
- Final: All areas compliant, comprehensive testing and documentation, proactive replacement schedule, integrated with fire alarm system
Investment: Approximately $18,500 over three years (Y1 corrections + proactive Y2-Y3 battery replacements)
Result: Emergency lighting system functioning optimally, preventing potential evacuation hazards, integrated with overall fire safety infrastructure
—
What Campus Safety Directors Learned
Regular fire safety inspections provide three distinct advantages:
Advantage 1: Identification of Issues Before They Become Hazards
The first inspection identified 15 emergency lighting areas below code minimum. Without that inspection, those areas would have remained below standard—not a violation necessarily discovered in emergency, but a risk that could have contributed to evacuation difficulty if needed.
Regular inspections identify emerging issues (proactive) rather than waiting for emergency discovery (reactive).
Advantage 2: Prioritization by Actual Risk
Rather than random correction attempts, regular inspection enables prioritization:
- Life safety systems first (emergency lighting, detection)
- System effectiveness second (response time, audibility)
- Documentation and process third
This risk-based approach focuses investment where it matters most.
Advantage 3: Declining Cost Over Time
Year 1 required significant investment ($29,100) because the facility was catching up on deferred optimization. Year 2 and Year 3 required less investment ($12,800 and $8,200) because baseline systems were already optimized—only proactive maintenance and preventive replacement remained.
Regular inspections enable facilities to shift from reactive (expensive) to proactive (less expensive) maintenance.
—
The Continuous Improvement Difference
Many facilities conduct inspections when required. This campus conducted regular quarterly inspections and approached each one as an opportunity for continuous improvement rather than a compliance checkbox.
The difference shows in the data:
- 35 issues identified and corrected over three years
- Decreasing cost per year as optimization was achieved
- Safety infrastructure that improved (not just maintained)
- Integrated systems that work together (not independently)
- Documented processes that enable emergency response
—
Making Regular Fire Safety Inspections Work
Regular fire safety inspections only deliver value when they drive action.
48Fire Protection helps educational facilities and commercial campuses establish systematic inspection and correction programs. Rather than one-time audits, 48Fire Protection partners with facilities to implement continuous inspection cycles—quarterly or annual depending on facility complexity.
Each inspection identifies specific issues. Each correction strengthens safety infrastructure. Each follow-up inspection verifies results and identifies emerging issues.
The three-year campus experience demonstrates that regular fire safety inspection isn’t bureaucratic compliance. It’s systematic safety infrastructure improvement.
A facility that commits to regular fire safety inspections doesn’t just meet code. It continuously strengthens its ability to protect occupants in emergency situations.
That’s the real value of systematic inspection: not compliance achieved, but safety continuously improved.
—
Ready to Start Your Continuous Improvement Cycle?
This campus achieved measurable safety improvement over three years through systematic regular inspections. Your facility can do the same.
The first step is establishing a baseline: understanding what your facility currently has, how it performs against standards, and what issues exist that can be addressed through a strategic inspection and correction program.
48Fire Protection helps educational institutions, commercial facilities, and multi-building campuses establish and maintain regular fire safety inspection programs. Rather than one-time audits, we partner with facilities to implement quarterly or annual inspection cycles—consistent review that identifies issues early, enables strategic prioritization, and drives continuous safety infrastructure improvement.
The three-year campus experience shows what’s possible: from identified vulnerabilities to optimized systems, from reactive corrections to proactive maintenance, from “meeting code” to “exceeding safety standards.”
[Contact 48Fire Protection] today to discuss establishing a regular fire safety inspection program for your facility. Let’s talk about how systematic, continuous inspection can drive measurable safety improvement in your building.