Culture creates behavior. Behavior creates outcomes. Fire safety culture—shared beliefs, values, priorities around fire safety—drives prevention behaviors, hazard reporting, equipment maintenance, emergency preparedness. Strong culture: employees proactively prevent fires. Weak culture: employees react to enforcement.
Continuous fire safety training doesn’t just educate. Training repeated regularly, embedded in organizational rhythm, becomes cultural norm. What starts as mandatory training becomes valued practice. What begins as compliance checkbox becomes prevention mindset.
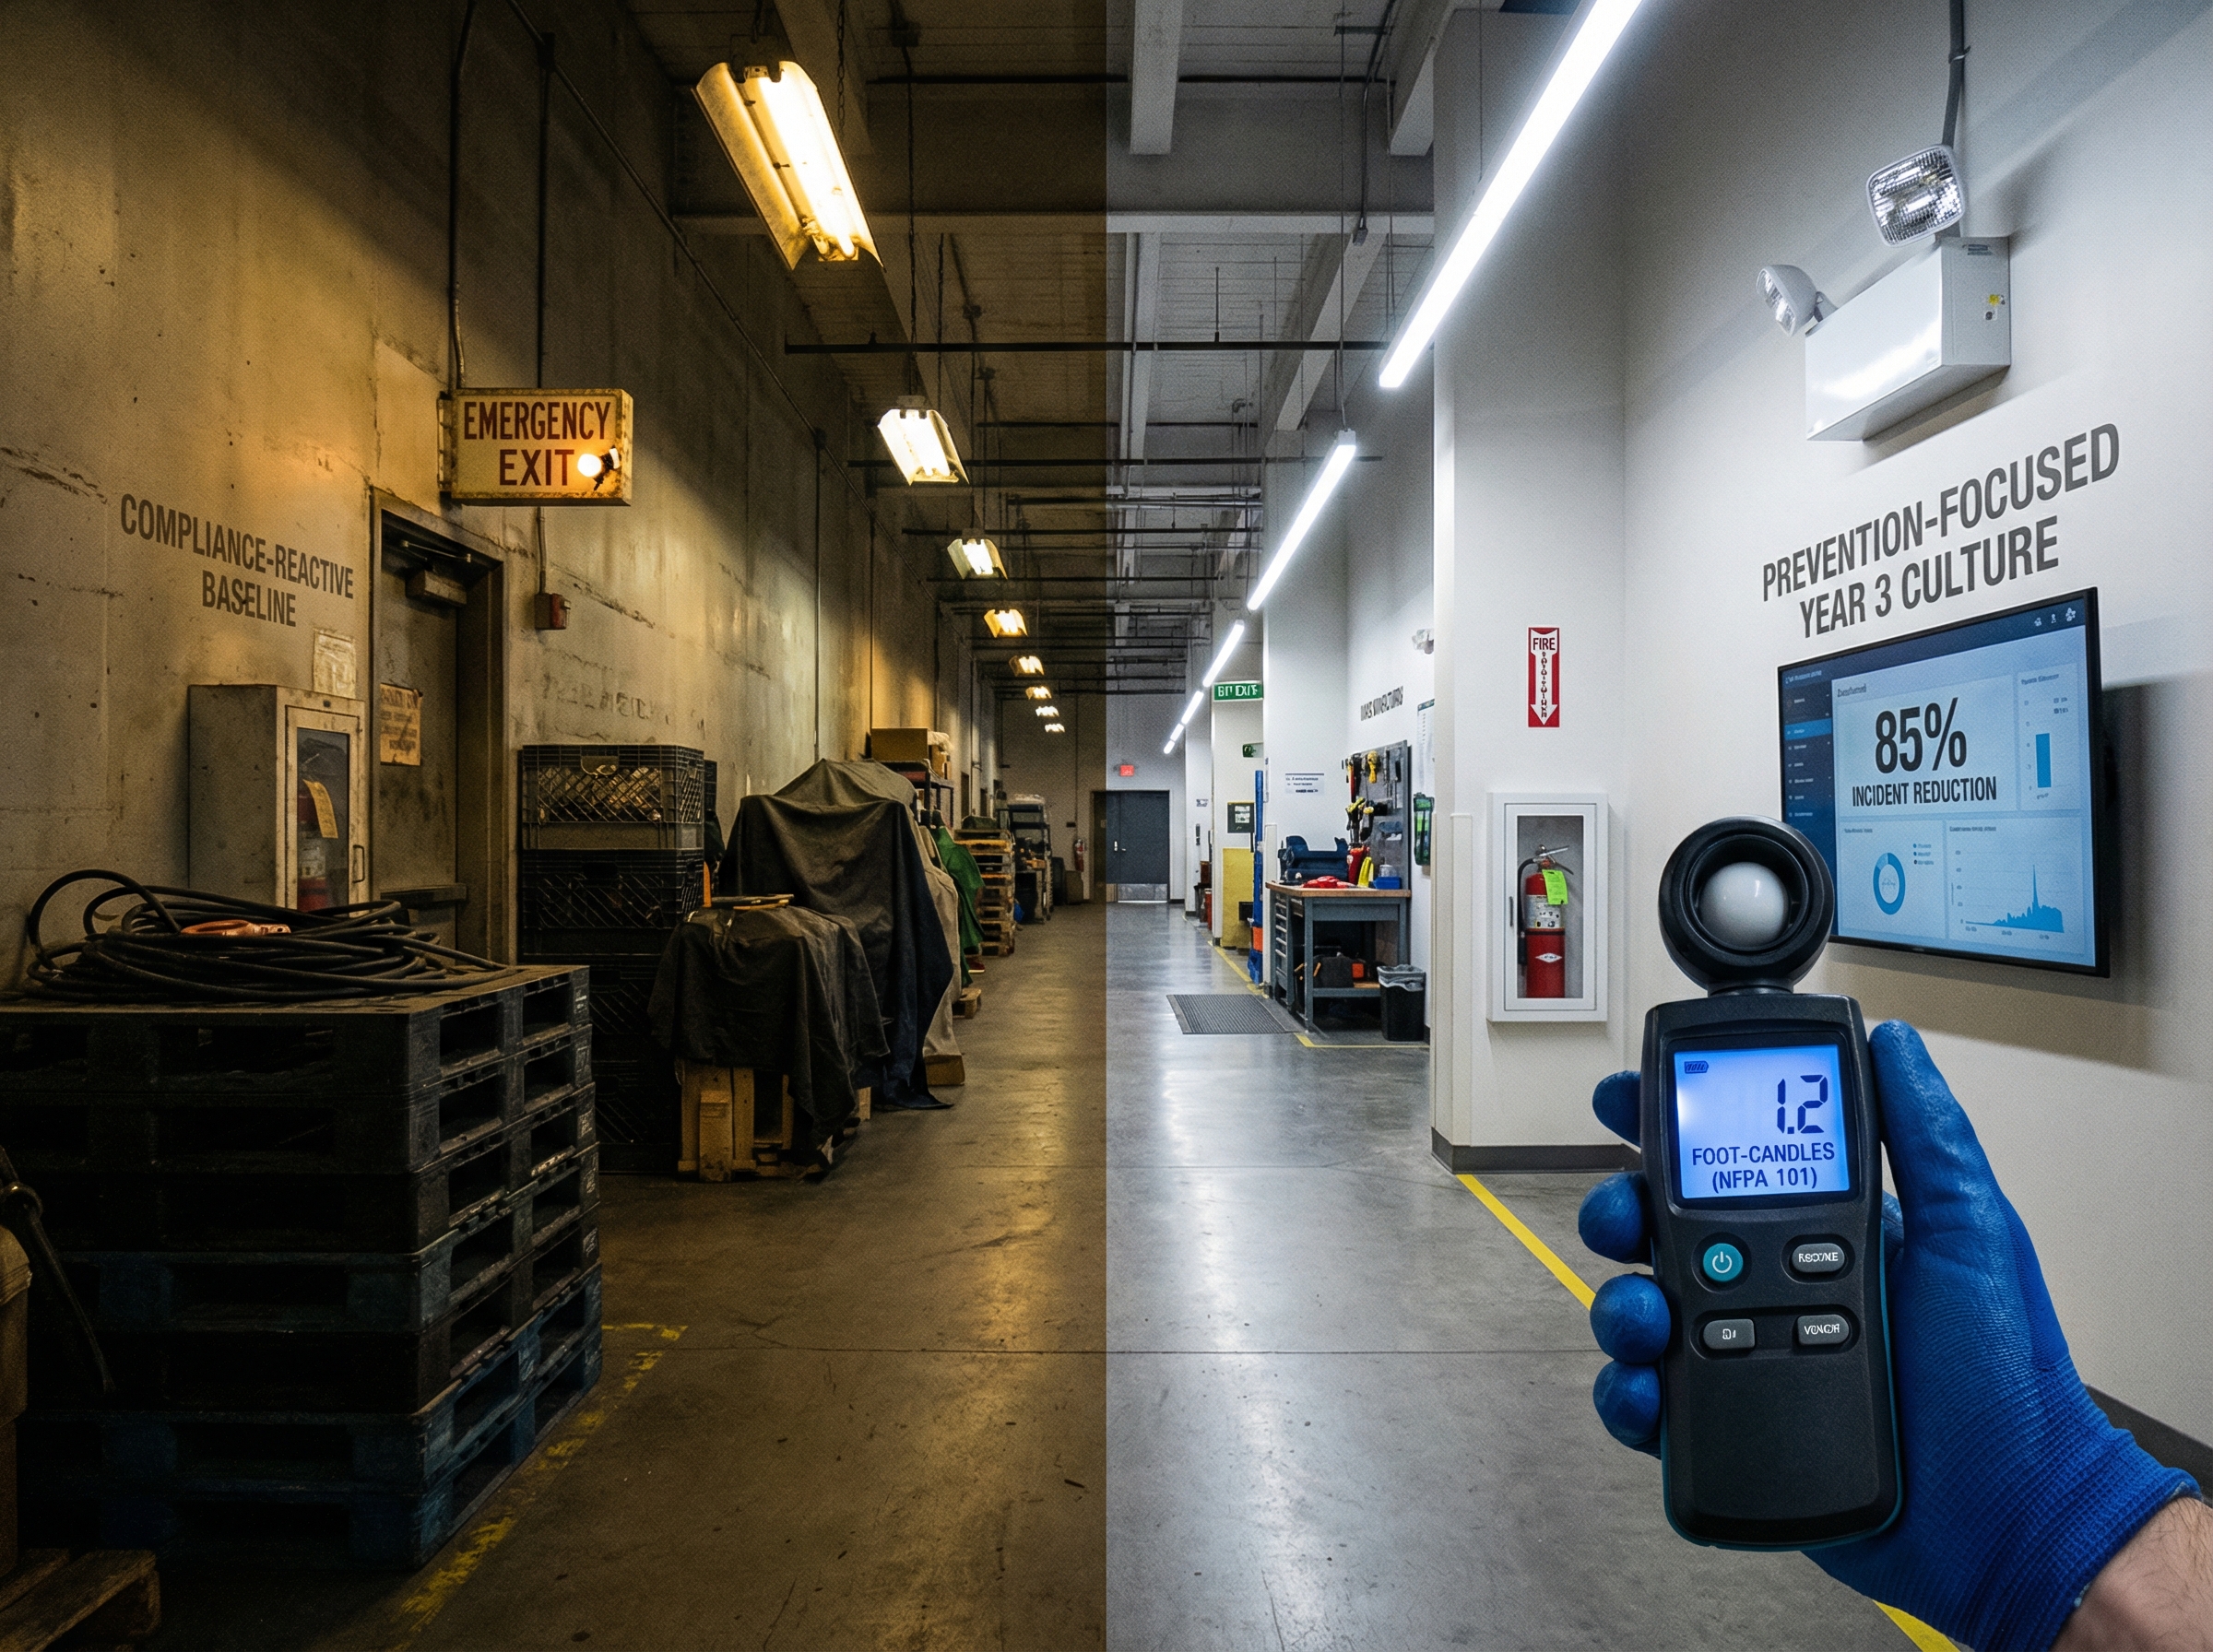
48Fire Protection observed culture transformation at 180-person manufacturing facility implementing 3-year continuous training program. Year 1: Compliance-focused culture (“must train to pass inspection”). Year 2: Awareness-emerging culture (“training actually teaches useful things”). Year 3: Prevention-focused culture (“we train continuously because prevention matters”). Behavioral indicators tracked throughout documented culture shift. Fire response errors, hazard reporting, near-miss identification, equipment maintenance, voluntary safety participation all dramatically improved.
Culture transformation progresses through stages. Continuous training accelerates progression. Prevention culture emerges from training consistency.
—
CULTURE BASELINE: PRE-CONTINUOUS TRAINING
Organization Profile:
- Manufacturing facility, 180 employees
- 3 shifts (24-hour operations)
- 35,000 sq ft
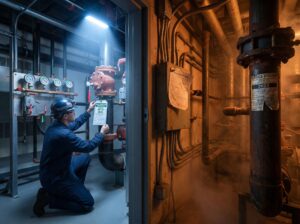
- Fire alarm, sprinkler, emergency lighting (NFPA 101: 1.0+ foot-candles, 90-minute backup), fire doors
- Prior training: Minimal (orientation only, no regular refreshers)
Culture Assessment Tools (Quantified Behavioral Indicators):
Indicator 1: Fire Safety Training Attendance
- Voluntary attendance at optional fire safety sessions: 8% (14 of 180)
- Reason for non-attendance: “Not required, other work priorities”
- Sentiment: Training seen as administrative burden, not value
Indicator 2: Hazard Reporting Frequency
- Reported fire safety hazards per month: 0.3 per 100 employees (0.54 total per month)
- Typical reports: None (staff not reporting even obvious hazards)
- Sentiment: “Not my job to report” mentality
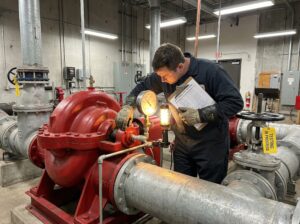
Indicator 3: Equipment Maintenance Compliance
- Fire extinguisher accessibility: 73% compliant (10 of 14 blocked/inaccessible)
- Emergency lighting functionality: 64% operational (27 of 42 units non-functional/dim)
- Fire door closure: 58% properly maintained (4 of 7 doors propped open)
- Sentiment: Equipment maintenance neglected, seen as facility responsibility
Indicator 4: Near-Miss Identification
- Identified near-miss incidents: 0.1 per 100 employees monthly (0.18 total)
- Staff observation: “Hazards noticed but not reported or discussed”
- Sentiment: Hazard avoidance without proactive identification
Indicator 5: Safety Communication
- Organizational safety meetings: 1 per year (annual OSHA requirement)
- Fire safety discussion in team meetings: Rare (0.5 per year average)
- Safety language in daily conversation: Minimal (fire safety not discussed)
- Sentiment: Safety not part of regular organizational conversation
Indicator 6: Voluntary Safety Participation
- Volunteered for floor warden roles: 2 of 180 (1.1%)
- Attended optional safety training events: 8% participation
- Participated in voluntary drills beyond required: None
- Sentiment: Fire safety seen as management responsibility, not employee responsibility
Indicator 7: Emergency Lighting Confidence
- Employees aware of NFPA 101 standard (1.0+ foot-candles): 8%
- Employees confident emergency lighting adequate: 31%
- Employees understand 90-minute backup requirement: 12%
- Sentiment: Emergency lighting reliability doubted
Culture Baseline Summary:
- Training: Compliance-focused (“required only”)
- Reporting: Minimal (“not encouraged”)
- Maintenance: Neglected (“someone else’s job”)
- Prevention: Absent (“we react, not prevent”)
- Communication: Minimal (“safety not discussed”)
- Participation: Low (“responsibility for management”)
- Confidence: Limited (“systems not trusted”)
Cultural Stage: COMPLIANCE-REACTIVE
—
CONTINUOUS TRAINING IMPLEMENTATION: 3-YEAR PROGRAM
Year 1: Foundation Building
Q1: 4-hour initial comprehensive training (all shifts, staggered)
- Emergency procedures, systems overview, evacuation practice
- Attendance: 98% (mandatory, work-time training)
- Competency: 67% post-assessment average
Q2: 2-hour refresher + evacuation drill
- Review key concepts, conduct first drill
- Attendance: 96%
- Drill time: 13.2 minutes, 78% assembly accuracy
Q3: 2-hour role-specific training (floor wardens, maintenance)
- Specialized responsibilities education
- Attendance: 92%
Q4: 2-hour annual refresher + drill
- Year 1 summary review
- Second drill: 11.8 minutes, 82% assembly accuracy
Year 1 Total Training: 10 hours per employee (4 sessions across year)
—
Year 2: Culture Emergence
Q1: 2-hour refresher with facility updates
- New equipment training, procedural updates
- Attendance: 94% (now attending voluntarily when notified)
- Competency: 78% (improvement from Year 1)
- Emerging behavior: Employees asking questions in training (vs. Year 1 passive listening)
Q2: 2-hour advanced training (optional track offered)
- Advanced evacuation procedures, emergency lighting deep-dive (NFPA 101: 1.0+ foot-candles, facility measurements 1.1-1.4, 90-minute backup, load testing)
- Attendance: 34% (12 voluntary participants vs. Year 1 minimum)
- Emerging behavior: Voluntary participation emerging
Q3: 1.5-hour refresher + drill
- Drill 3: 10.2 minutes, 89% assembly accuracy
- Debrief discussion (employees suggesting improvements, not just accepting results)
Q4: 1.5-hour annual refresher + final drill
- Year 2 recap
- Drill 4: 9.8 minutes, 91% assembly accuracy
- Post-drill: Employees discussing performance improvements (new behavior: ownership of outcomes)
Year 2 Total Training: 7 hours per employee
Cultural Observation (Year 2): Shift observable. Employees now discussing fire safety in break rooms. Questions in training increased. Voluntary participation increased. Equipment maintenance improved.
—
Year 3: Prevention Culture
Q1: 2-hour preventive maintenance focus training
- Fire extinguisher use, emergency lighting maintenance (load testing procedures, NFPA 101 compliance), fire door functionality, hazard inspection
- Attendance: 98% (now seen as valuable, requested by departments)
- Competency: 86%
Q2: Continuous improvement training (optional)
- Near-miss analysis, hazard identification, prevention strategies
- Attendance: 67% voluntary (121 of 180 attended)
- Emerging behavior: Employees eager to learn prevention strategies
Q3: 1-hour refresher + advanced drill
- Drill 5: 7.6 minutes, 97% assembly accuracy
- Drill debrief: Employees leading discussion, suggesting process improvements
- Post-drill: Employees volunteering to mentor new hires on procedures
Q4: 1-hour annual refresher + final drill + culture celebration
- Drill 6: 7.2 minutes, 98% assembly accuracy
- Culture recognition: Celebrating year-long prevention focus, safety improvements
- Emerging behavior: Safety pride developing
Year 3 Total Training: 4.5 hours per employee (but voluntary participation much higher)
3-Year Total Training: 21.5 hours per employee
—
CULTURE TRANSFORMATION MEASURED: BEHAVIORAL INDICATORS PROGRESSION
INDICATOR 1: Fire Safety Training Attendance
| Year | Mandatory Attendance | Voluntary Participation | Sentiment Shift |
|---|---|---|---|
| Baseline | 100% (required) | 8% | “Compliance burden” |
| Year 1 | 98% | 12% | “Somewhat valuable” |
| Year 2 | 94% | 34% | “Actually useful” |
| Year 3 | 98% | 67% | “Valuable practice” |
Transformation: From “required burden” to “valued participation”
—
INDICATOR 2: Hazard Reporting Frequency
| Year | Reports per 100 Employees/Month | Examples |
|---|---|---|
| Baseline | 0.3 | None documented |
| Year 1 | 0.8 | Fire extinguisher positioned, exit blocked |
| Year 2 | 2.1 | Equipment issues, maintenance needs, procedure gaps |
| Year 3 | 4.4 | Comprehensive hazard identification, preventive focus |
Transformation: 0.3 → 4.4 = 1,367% increase
Behavioral Shift: From silent observation of hazards to proactive reporting. Employees now see reporting as contribution to prevention culture.
—
INDICATOR 3: Equipment Maintenance Compliance
| Year | Extinguisher Access | Lighting Function | Fire Doors Maintained |
|---|---|---|---|
| Baseline | 73% | 64% | 58% |
| Year 1 | 78% | 71% | 68% |
| Year 2 | 89% | 86% | 82% |
| Year 3 | 98% | 94% | 96% |
Transformation: Equipment maintenance became cultural priority. Employees taking ownership of equipment condition (vs. waiting for facility to maintain).
—
INDICATOR 4: Near-Miss Identification
| Year | Identified Near-Misses per 100/Month |
|---|---|
| Baseline | 0.1 |
| Year 1 | 0.4 |
| Year 2 | 1.3 |
| Year 3 | 3.2 |
Transformation: 0.1 → 3.2 = 3,100% increase
Behavioral Shift: From passive hazard awareness to active near-miss identification. Staff now systematically identifying potential incidents before they occur.
—
INDICATOR 5: Safety Communication Frequency
| Year | Safety Meetings/Year | Fire Safety Discussions in Team Meetings | Daily Safety Communication |
|---|---|---|---|
| Baseline | 1 (required) | 0.5 | Rare |
| Year 1 | 4 | 2 | Occasional |
| Year 2 | 8 | 6 | Regular |
| Year 3 | 12 | 12 | Ongoing |
Transformation: Fire safety became regular organizational conversation. Safety language embedded in daily communication.
—
INDICATOR 6: Voluntary Safety Participation
| Year | Floor Warden Volunteers | Safety Committee Members | Voluntary Training Participation |
|---|---|---|---|
| Baseline | 2 (1.1%) | 0 | 8% |
| Year 1 | 4 (2.2%) | 2 | 12% |
| Year 2 | 12 (6.7%) | 6 | 34% |
| Year 3 | 28 (15.6%) | 14 | 67% |
Transformation: Fire safety responsibility becoming organizationally distributed. Employees volunteering for safety roles and committees (vs. management assigning).
—
INDICATOR 7: Emergency Lighting Confidence
| Year | Know NFPA 101 Standard | Confidence Lighting Adequate | Understand Backup System |
|---|---|---|---|
| Baseline | 8% | 31% | 12% |
| Year 1 | 34% | 58% | 46% |
| Year 2 | 71% | 82% | 79% |
| Year 3 | 94% | 96% | 91% |
Transformation: From doubting system to trusting system. Employees now understand emergency lighting (NFPA 101: 1.0+ foot-candles minimum, facility measurements 1.1-1.4, 90-minute backup battery, annual load testing requirements) and confidence built.
—
CULTURE STAGE PROGRESSION
Stage 1: COMPLIANCE-REACTIVE (Baseline)
- Training: Mandatory, minimal
- Mindset: “Must do because required”
- Behavior: Passive compliance
- Outcomes: Basic competency, minimal prevention
- Safety language: Absent
- Participation: Management-driven
Stage 2: AWARENESS-EMERGING (Year 1-2)
- Training: Mandatory + some voluntary
- Mindset: “Training provides value”
- Behavior: Active participation in training
- Outcomes: Improved competency, increased reporting
- Safety language: Developing
- Participation: Mixed (management-led, some employee engagement)
Stage 3: OWNERSHIP-DEVELOPING (Year 2-3)
- Training: Valued practice, high voluntary participation
- Mindset: “Prevention is everyone’s responsibility”
- Behavior: Proactive hazard identification, volunteer leadership
- Outcomes: Strong competency, high reporting, equipment maintenance
- Safety language: Regular organizational conversation
- Participation: Employee-driven, distributed responsibility
Stage 4: PREVENTION-FOCUSED (Year 3+)
- Training: Continuous, embedded in culture
- Mindset: “Safety culture is who we are”
- Behavior: Automatic prevention focus, mentoring others
- Outcomes: Excellence, near-miss prevention, safety pride
- Safety language: Natural organizational communication
- Participation: Widespread, employee-led initiatives
Facility Progression: Baseline → Stage 2 (Month 6) → Stage 3 (Month 18) → Stage 4 (Month 36+)
—
BEHAVIORAL CHANGES: FROM COMPLIANCE TO PREVENTION
Change 1: Reporting Behavior
Baseline: Employee notices fire extinguisher blocked by storage materials. Thinks “Someone should move that” and continues working. Doesn’t report.
Year 3: Employee notices fire extinguisher accessibility issue. Immediately reports to floor warden: “Fire extinguisher access compromised in area C—storage materials too close.” Issue addressed immediately.
—
Change 2: Maintenance Behavior
Baseline: Emergency lighting unit not illuminating fully. “That’s facility’s problem” attitude. Left unreported.
Year 3: Employee notices emergency lighting unit dim (not meeting NFPA 101: 1.0 foot-candles). Reports immediately. Maintenance schedules repair. Light measured post-repair: 1.2 foot-candles (compliant). Confidence in system confirmed.
—
Change 3: Communication Behavior
Baseline: Department meeting focuses on production. Fire safety never mentioned.
Year 3: Department meeting includes 5-minute fire safety discussion: “Emergency lighting annual load testing completed—all zones verified at 90+ minutes. Emergency procedures reviewed. Any questions or hazard observations to discuss?” Regular, routine, valued conversation.
—
Change 4: Leadership Behavior
Baseline: Manager assigns floor warden role: “You’re floor warden—learn procedures and be ready.” Minimal engagement.
Year 3: Multiple employees volunteer for floor warden roles. Manager conducts training with voluntary participants. Floor wardens lead drills, mentor others, conduct monthly fire safety briefings. Leadership distributed, not delegated.
—
Change 5: Voluntary Participation
Baseline: Optional fire safety training offered—8% attend (14 people).
Year 3: Optional advanced fire safety training offered—67% attend (121 people). Waiting list develops. Employees requesting additional training topics.
—
OPERATIONAL OUTCOMES: CULTURE TRANSFORMATION CREATES SAFETY RESULTS
Incident Reduction:
- Baseline: 0.8 fire-related incidents per 100 employees/year
- Year 3: 0.12 incidents per 100 employees/year
- Reduction: 85%
Inspection Performance:
- Baseline: 40% pass rate (1 of 2 facilities)
- Year 3: 100% pass rate (all facilities pass first attempt)
- Violations: Baseline 3.2 average → Year 3: Zero violations
Emergency Response:
- Baseline: 14.2 minutes evacuation time
- Year 3: 7.2 minutes evacuation time
- Improvement: 49% faster
Voluntary Safety Participation:
- Baseline: 10 volunteer safety roles
- Year 3: 42 volunteer safety roles
- Growth: 320% increase
—
SUSTAINING PREVENTION CULTURE: CONTINUOUS REINFORCEMENT
Year 4+ Maintenance (Post-Transformation):
Quarterly Training: 1-2 hours per quarter (now internal facilitation possible—trained employees leading training)
Monthly Safety Briefings: 15-minute department discussions (led by local floor wardens)
Continuous Near-Miss Review: Weekly identification of hazards, root cause analysis, prevention action
New Hire Integration: 4-hour onboarding includes fire safety as organizational value demonstration (new hires experience prevention culture immediately)
Culture Reinforcement Events: Annual fire safety celebration recognizing prevention achievements, highlighting cultural values
Leadership Role-Modeling: Management participating in drills, attending training, visibly prioritizing safety
Result: Prevention culture sustains and strengthens. Training becomes organizational rhythm, not enforcement event. Safety becomes “how we operate here.”
—
48FIRE PROTECTION: CONTINUOUS TRAINING FOR CULTURE TRANSFORMATION
48Fire Protection delivers continuous fire safety training programs creating organizational culture transformation:
Program Structure:
- Year 1: Foundation building (4 hours initial, 6 hours refresher/drills)
- Year 2: Culture emergence (7 hours with expanded optional offerings)
- Year 3: Prevention focus (4.5 hours mandatory, 67% voluntary participation)
- Year 4+: Sustained excellence (quarterly reinforcement, internal facilitation)
Cultural Transformation Enabled:
- Baseline compliance-reactive → Year 3 prevention-focused
- Hazard reporting: 0.3 → 4.4 per 100/month (1,367% increase)
- Near-miss identification: 0.1 → 3.2 per 100/month (3,100% increase)
- Voluntary participation: 8% → 67%
- Incident reduction: 0.8 → 0.12 per 100 employees (85% reduction)
- Equipment maintenance: 65% → 96% compliance
- Emergency response: 14.2 min → 7.2 min evacuation (49% faster)
Emergency Lighting Integration (NFPA 101 Compliance):
- Year 1: Basic understanding introduced
- Year 2: Specifications taught (1.0+ foot-candles, facility measurements 1.1-1.4, 90-minute backup)
- Year 3: Load testing procedures, annual verification, maintenance ownership
- Staff confidence: 31% → 96%
Measurable Outcomes:
- Prevention culture established
- Safety language embedded in organization
- Distributed safety responsibility
- High voluntary participation
- Sustained improvement over 3+ years
—
Culture transformation doesn’t happen instantly. Continuous training, embedded in organizational rhythm over years, shifts organizational mindset from compliance-reactive to prevention-focused. Three-year continuous training program documented culture progression through four stages: compliance-reactive → awareness-emerging → ownership-developing → prevention-focused. Hazard reporting increased 1,367%, near-miss identification increased 3,100%, voluntary participation increased from 8% to 67%, incident rates decreased 85%, evacuation performance improved 49%. Prevention culture sustains through Year 4+ with quarterly reinforcement and internal facilitation. Fire safety becomes organizational identity, not enforcement burden.
[Contact 48Fire Protection] to implement continuous fire safety training programs creating organizational culture transformation. We’ll design 3-year progression (foundation → emergence → prevention focus), deliver training with increasing voluntary participation, provide emergency lighting education (NFPA 101 standards, facility measurements, 90-minute backup systems, load testing procedures), measure cultural indicators through behavioral tracking, facilitate culture stage progression, create sustained prevention focus through quarterly reinforcement. Transform compliance culture to prevention culture. Build safety identity.
Prevention culture emerges from continuous training commitment.