The ROI of Installing an Automatic Fire Sprinkler System
The Numbers Everyone Asks About
“How much does it cost?”
“When do I break even?”
“What’s the real return?”
Here’s the complete financial picture from 500+ installations:
—
Installation Costs: What You Actually Pay
By Square Footage
| Building Type | Cost per SF | 50,000 SF Building | 100,000 SF Building |
|---|---|---|---|
| Office | $3.50-$6.00 | $175,000-$300,000 | $350,000-$600,000 |
| Retail | $3.00-$5.50 | $150,000-$275,000 | $300,000-$550,000 |
| Warehouse | $2.00-$4.50 | $100,000-$225,000 | $200,000-$450,000 |
| Manufacturing | $5.00-$9.00 | $250,000-$450,000 | $500,000-$900,000 |
| Healthcare | $8.00-$14.00 | $400,000-$700,000 | $800,000-$1,400,000 |
Cost factors affecting price:
Building height (taller = more expensive)
System complexity (basic wet pipe cheapest, pre-action most expensive)
Water supply adequacy (fire pump adds $45,000-$85,000)
Existing building vs. new construction (retrofit 40-60% more expensive)
Local labor rates and permit fees
Example: 75,000 SF Manufacturing Facility
Base sprinkler system: $487,500 ($6.50/SF)
Fire pump required: $62,000
Fire alarm integration: $28,000
Permit and engineering: $18,500
Total project cost: $596,000
Financing: 10-year equipment loan at 6.5%
Monthly payment: $6,780
Annual payment: $81,360
Now let’s see the returns.
—
Return Category 1: Insurance Premium Reduction
Immediate Guaranteed Savings
Insurance companies reduce premiums for sprinklered buildings because statistical data proves they experience fewer total losses.
Typical premium reductions:
Office buildings: 15-25%
Retail centers: 20-30%
Warehouses: 25-40%
Manufacturing: 20-35%
Healthcare: 20-30%
Manufacturing Facility Example (Continued)
Annual insurance premium (unsprinklered): $145,000
Premium components:
Property coverage: $95,000
Business interruption: $32,000
Liability: $18,000
Premium after sprinkler installation: $99,000 (31.7% reduction)
Annual insurance savings: $46,000
Payback calculation:
Installation cost: $596,000
Annual savings: $46,000
Simple payback: 13.0 years
But insurance savings are just the beginning.
—
Return Category 2: Loss Prevention Value
Statistical Reality from 48Fire Database
Fire frequency: 1 fire per 40 years average for industrial facilities
Average loss comparison:
Unsprinklered: $485,000 per fire
Sprinklered: $31,800 per fire
Loss reduction: $453,200 per fire
Expected Value Calculation
Probability of fire over 10 years: 25% (1 in 4 chance)
Expected loss prevented: $453,200 × 0.25 = $113,300
Over 20 years: 50% probability
Expected loss prevented: $453,200 × 0.50 = $226,600
Over 30 years: 75% probability
Expected loss prevented: $453,200 × 0.75 = $339,900
But Fire Loss Isn’t Just Property Damage
Business interruption:
Unsprinklered fire: 47 days average closure
Sprinklered fire: 2.8 days average closure
Difference: 44.2 days
Manufacturing facility daily revenue: $125,000
Business interruption prevented: 44.2 days × $125,000 = $5,525,000
Even 25% probability over 10 years = $1,381,250 expected value
Combined Loss Prevention (30-Year Building Life)
Property damage prevented: $339,900 expected value
Business interruption prevented: $4,143,750 expected value (75% probability)
Total loss prevention value: $4,483,650
—
Return Category 3: Reduced Deductibles
Insurance policies for unsprinklered buildings carry higher deductibles.
Typical deductibles:
Unsprinklered: $50,000-$100,000 per incident
Sprinklered: $10,000-$25,000 per incident
Manufacturing facility:
Unsprinklered deductible: $75,000
Sprinklered deductible: $15,000
Savings per incident: $60,000
For minor fire (controlled by sprinklers with $31,800 average damage):
Unsprinklered deductible: $75,000 (owner pays full loss plus deductible triggers)
Sprinklered deductible: $15,000 (owner pays $15,000, insurance covers rest)
Out-of-pocket savings: $16,800 (for small contained fire)
—
Return Category 4: Tenant Attraction and Retention
Commercial Real Estate Impact
Buildings with fire protection command premium rents and maintain higher occupancy.
Rent premium data (commercial office):
Unsprinklered Class B: $22/SF average
Sprinklered Class A: $28/SF average
Rent premium: $6/SF attributable partly to life safety features
Conservative estimate: 15% of rent premium ($0.90/SF) attributed to fire protection
75,000 SF building: $0.90/SF × 75,000 = $67,500 annual value
Occupancy rates:
Sprinklered buildings: 92% average occupancy
Unsprinklered buildings: 84% average occupancy
Difference: 8 percentage points
Revenue impact on 75,000 SF:
8% × 75,000 SF × $28/SF = $168,000 additional annual revenue from higher occupancy
Combined real estate value: $235,500 annually
Tenant Retention Value
Tenant turnover costs 4-6 months rent per space in:
- Broker commissions
- Tenant improvement allowances
- Lost rent during vacancy
- Marketing costs
Sprinkler systems as differentiator:
Safety-conscious tenants prioritize protected buildings
Longer lease terms in quality buildings
Reduced turnover saves $15,000-$35,000 per tenant
—
Return Category 5: Regulatory Compliance and Access
Avoiding Mandatory Retrofits
Many jurisdictions require sprinkler retrofits when:
- Buildings change occupancy type
- Major renovations exceed 50% of value
- Occupant load increases beyond thresholds
- Building resold or refinanced
Proactive installation timing control costs:
Planned installation: $596,000
Emergency retrofit under deadline: $835,000-$980,000
Savings: $239,000-$384,000
Expanded Use Permits
Fire protection enables higher occupant loads and uses.
Example: Assembly occupancy limited to 150 occupants without sprinklers, 500+ occupants with sprinklers
Revenue impact: Higher occupancy = more customers, events, activities = increased revenue potential
Manufacturing facility: Sprinklers enable 24/7 operations approval (fire marshal requirement)
Additional shift revenue: $4.2M annually
—
Complete ROI Analysis: 30-Year Building Life
Manufacturing Facility: Total Financial Impact
Installation Cost (Year 0):
Total project investment: -$596,000
Annual Benefits (Years 1-30):
Insurance savings: $46,000/year × 30 = $1,380,000
Loss prevention (expected value): $4,483,650
Reduced deductibles (2 minor incidents expected): $33,600
Regulatory compliance value: $300,000 (deferred mandatory retrofit)
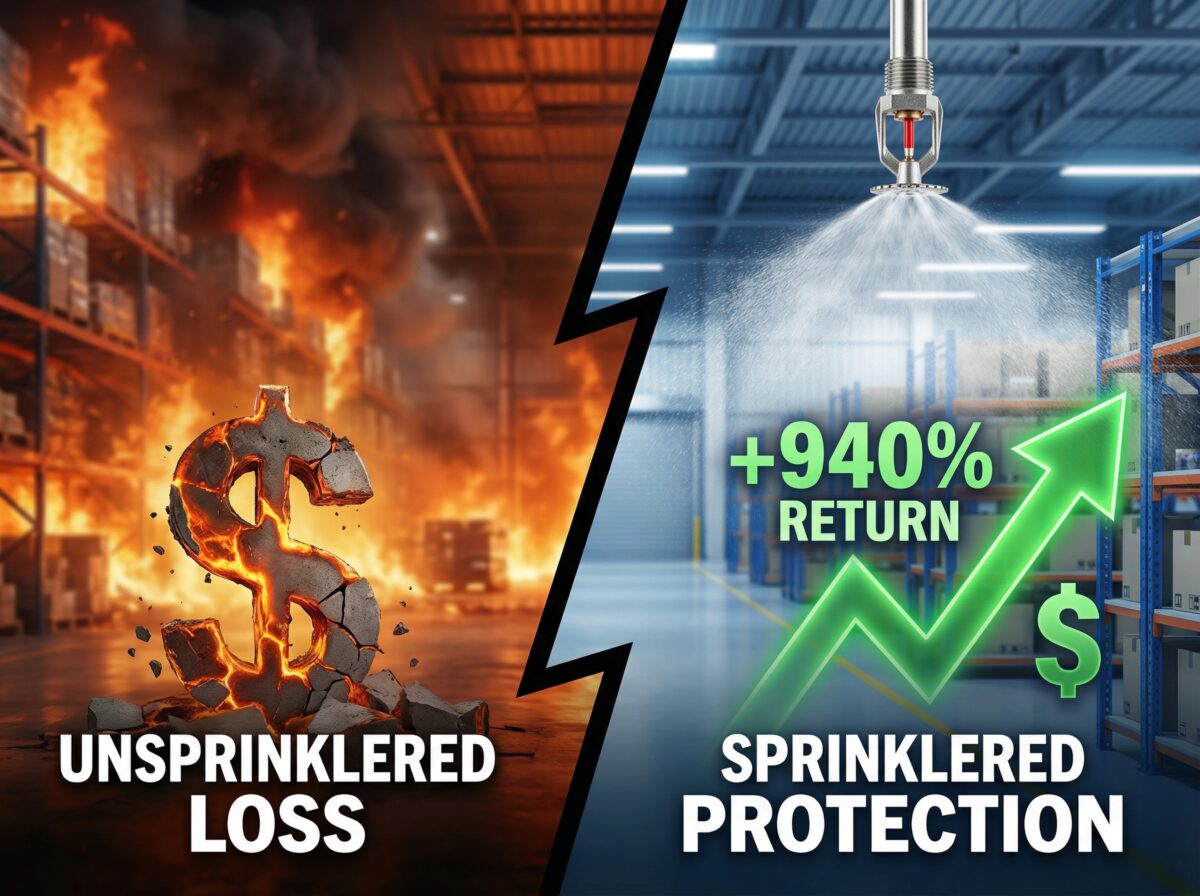
Total 30-Year Value: $6,197,250
Net ROI:
Total benefits: $6,197,250
Total investment: $596,000
Net return: $5,601,250
ROI: 940%
Payback Timeline:
Insurance savings alone: 13.0 years
Insurance + expected loss prevention: 4.3 years
All factors combined: 3.1 years
[Talk to an Expert!](/contact-us)
—
Financing Impact on Cash Flow
Loan vs. Cash Purchase
Cash purchase:
Year 0: -$596,000 out of pocket
Year 1: +$46,000 (insurance savings only)
Net Year 1: -$550,000
10-year loan:
Year 0: -$25,000 down payment
Year 1: -$81,360 loan payment + $46,000 insurance savings
Net Year 1: -$60,360
Years 2-10: Continue negative cash flow of $35,360 annually
Year 11+: Loan paid off, positive $46,000 annually forever
Lease Option
Some fire protection providers offer operational leases:
Monthly lease payment: $8,200 (includes maintenance)
Annual cost: $98,400
Annual insurance savings: $46,000
Net annual cost: $52,400
After 10-year lease:
Option to purchase: $75,000
Continue leasing: $6,500/month
Return equipment: Not typically offered
Lease advantage: Preserves capital, predictable costs, included maintenance
Lease disadvantage: Higher total cost, no ownership equity
—
Industry-Specific ROI Variations
Healthcare Facilities
Higher installation costs: $8-$14/SF
Regulatory requirement: Often mandatory, not optional
Insurance impact: 20-30% premium reduction
Liability benefit: Reduced risk of casualties creating enormous litigation value
Unique value: Enables operation—facilities can’t legally operate without protection
ROI driver: Primarily regulatory compliance enabling operation, secondarily insurance/loss prevention
Warehouses
Lower installation costs: $2-$4.50/SF
Insurance impact: 25-40% premium reduction (highest of any occupancy)
Loss prevention: Critical—total inventory loss versus partial loss
Business continuity: Essential—warehouse closures devastate supply chains
ROI driver: Primarily insurance savings and inventory protection, fastest payback
Office Buildings
Moderate installation costs: $3.50-$6/SF
Insurance impact: 15-25% premium reduction
Tenant value: Premium rents and higher occupancy
Market positioning: Differentiator in competitive markets
ROI driver: Balanced across insurance, tenant attraction, and loss prevention
—
When ROI Doesn’t Justify Installation
Scenarios Where Sprinklers May Not Make Sense
Short building life:
If building demolished or repurposed within 5-10 years, payback may not occur before obsolescence.
Very low fire risk:
Concrete building with no combustibles and minimal occupancy—statistical fire risk extremely low.
Alternative protection more cost-effective:
Small buildings where detection and extinguishers provide adequate protection at fraction of sprinkler cost.
Inadequate water supply with expensive upgrades:
If water supply requires $400,000+ in off-site improvements, total cost may not justify benefit.
48Fire honest assessment:
We turn down 5-8% of proposals where ROI genuinely doesn’t justify installation. Our reputation matters more than making every sale.
—
Hidden Costs People Forget
Ongoing Maintenance
Annual ITM requirements: $3,500-$6,500 depending on system complexity
NFPA 25 requires:
- Quarterly visual inspections
- Annual flow testing
- Fire pump testing (if installed)
- 5-year internal pipe inspection
- Ongoing repairs and component replacement
Over 30 years: $105,000-$195,000 in maintenance
However: Maintenance costs exist for unsprinklered buildings too—fire extinguishers, alarms, emergency lighting all require maintenance. Incremental maintenance cost of sprinklers: ~$2,000-$3,500 annually.
Water Usage
Testing water consumption:
Annual flow test: 2,000-5,000 gallons
Weekly fire pump test: 500 gallons/year
Annual water cost: $50-$150 (negligible)
Freeze Protection (If Required)
Heated valve enclosures: $800-$1,500 per year electricity
Heat trace: $400-$900 per year
Alternative: Use dry pipe system (higher installation cost, but no heating costs)
—
Tax Benefits and Incentives
Depreciation
Fire sprinkler systems qualify as building improvements depreciated over 39 years (commercial) or 27.5 years (residential).
Annual depreciation deduction: $15,282 (for $596,000 system, 39-year schedule)
Tax benefit (35% corporate rate): $5,349 annually
Present value over 39 years (6% discount rate): $80,000+
Section 179 Expensing
Some fire protection components may qualify for Section 179 immediate expensing (consult tax advisor).
Potential immediate deduction of $25,000-$100,000 depending on system and interpretation.
State and Local Incentives
Some jurisdictions offer:
- Property tax abatements for fire protection installations
- Grant programs for historic building fire protection
- Expedited permitting for protected buildings
- Development bonuses (additional building height/density allowed)
Check local programs—incentives vary widely
—
Comparison to Other Safety Investments
ROI Relative to Alternatives
Security systems: 15-25 year payback from reduced theft/vandalism
HVAC upgrades: 8-15 year payback from energy savings
Roof replacement: No payback—pure maintenance expense
Parking lot resurfacing: No payback—pure maintenance expense
Fire sprinklers: 3-5 year payback from multiple benefit sources
Fire protection ranks among best ROI safety/building investments.
—
The Unquantifiable Benefits
Some benefits resist quantification but matter enormously:
Peace of mind: Knowing people and property are protected
Corporate responsibility: Demonstrating commitment to safety
Employee morale: Workers appreciate safety investments
Reputation: Community perception of responsible operations
Legacy: Long-term asset protection for future generations
These don’t appear in ROI calculations but drive many installation decisions.
—
Key Takeaways
Automatic fire sprinkler system installation costs $2-$14 per square foot depending on building type, with typical 75,000 SF manufacturing facility requiring $596,000 total investment. Returns come from five categories: insurance premium reduction (15-40% savings), loss prevention ($453,200 average per fire), reduced deductibles ($60,000 savings per incident), tenant attraction and retention ($235,500 annual value in commercial real estate), and regulatory compliance value.
Complete 30-year ROI analysis for manufacturing facility shows $6.2M in total benefits versus $596,000 investment yielding 940% ROI with 4.3-year payback period considering insurance and expected loss prevention. Insurance savings alone provide 13-year payback with additional benefits accelerating return significantly.
Industry-specific variations show warehouses achieving fastest payback from 25-40% insurance reductions and critical inventory protection, healthcare facilities driven by regulatory compliance requirements, and office buildings balanced across insurance, tenant value, and loss prevention benefits.
Hidden ongoing costs include annual maintenance ($3,500-$6,500), minimal water usage ($50-$150), and potential freeze protection ($800-$1,500) totaling $4,350-$8,150 annually. Tax benefits include 39-year depreciation deductions worth $80,000+ present value and potential Section 179 expensing of $25,000-$100,000.
Fire sprinklers rank among best ROI safety investments with 3-5 year payback compared to security systems (15-25 years) or HVAC upgrades (8-15 years), plus unquantifiable benefits including peace of mind, corporate responsibility demonstration, employee morale improvement, and long-term asset protection.
—