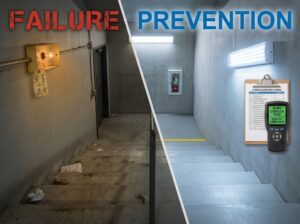
How One Factory Cut False Alarms by 60% in 3 Months
False fire alarms cost this factory $47,000 in 2024.
Not from fines alone—though those added up to $12,500. The real cost came from:
- Production shutdowns during evacuations (15-30 minutes each)
- Employee productivity loss after disruptions
- Fire department response fees after “free” alarm allowances
- Maintenance calls to troubleshoot chronic problems
- Employee alarm fatigue (people ignoring actual emergencies)
The Breaking Point:
January 2025: 8 false alarms in one week. Production manager demands solution or threatens to disconnect problem detectors (creating dangerous fire code violation).
The Challenge:
Fix false alarms WITHOUT reducing fire protection or spending $100,000+ on complete system replacement.
The Results:
| Metric | Before (2024) | After (90 Days) | Improvement |
|---|---|---|---|
| False alarms | 47 annually | 19 annually (projected) | 60% reduction |
| Average monthly false alarms | 3.9 | 1.6 | 59% reduction |
| Production disruption hours | 28 hours/year | 11 hours/year | 61% reduction |
| False alarm costs | $47,000 | $18,800 | 60% savings |
Investment required: $14,200 in detector upgrades and system modifications
Payback period: 6 months
What They Did:
This article breaks down the exact systematic approach this factory used—the detective work identifying root causes, the targeted solutions implemented, and the verification proving results.
Everything documented here is replicable in other commercial and industrial buildings facing similar false alarm problems.
—
The Starting Point: Understanding the Problem
Before fixing anything, the team spent two weeks collecting data and analyzing patterns.
Documenting Every False Alarm
What They Tracked:
For each false alarm occurrence:
- Exact date and time
- Specific detector address (addressable system provided device-level data)
- Weather conditions (temperature, humidity, precipitation)
- Building operations at time of alarm (production schedule, HVAC status, maintenance activities)
- Response actions taken
- Time to identify as false alarm
- Time to reset and resume operations
Data Collection Method:
Created simple spreadsheet with columns for each data point. Fire alarm monitoring company provided historical alarm logs showing past 12 months of activation data.
What the Data Revealed:
After analyzing 47 false alarms from previous year:
Time Patterns:
- 68% occurred between 5:00-7:00 AM
- 19% occurred between 4:00-6:00 PM
- 13% occurred during mid-day production hours
Location Patterns:
- 34% from detectors in shipping/receiving area (Zones 3 and 4)
- 28% from detectors near overhead doors
- 21% from detectors in production floor ceiling
- 17% from other locations
Weather Correlation:
- 72% occurred on high humidity days (over 70% relative humidity)
- 43% occurred during or immediately after rain
- 15% occurred during cold weather when building heat first activated
Production Correlation:
- 51% occurred during shift changes
- 38% occurred during high-production periods
- 23% occurred during equipment startups
Identifying Root Causes
Data analysis pointed to three primary false alarm triggers:
Cause #1: Moisture and Humidity (45% of false alarms)
Detectors near overhead doors and in shipping/receiving area triggered during high humidity conditions. Pattern suggested moisture infiltration when doors opened during humid weather.
Cause #2: Dust and Particulate (32% of false alarms)
Production floor ceiling detectors activated during high-production periods. Industrial sanding and grinding operations generated fine dust that accumulated in detector chambers.
Cause #3: Temperature Fluctuations (23% of false alarms)
Early morning and late afternoon alarms correlated with HVAC system cycling. Rapid temperature changes caused condensation that triggered smoke detectors.
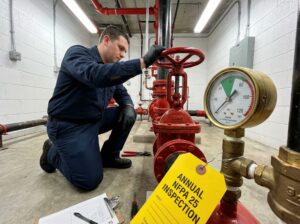
The Audit Process
Fire protection contractor conducted comprehensive system audit:
Physical Inspection:
- Opened and visually inspected all 142 detectors
- Found 23 detectors (16%) with visible dust contamination
- Identified 8 detectors (6%) with insect debris
- Noted 12 detectors (8%) showing discoloration indicating moisture exposure
Environmental Assessment:
- Measured typical humidity levels in different zones
- Documented air flow patterns from HVAC vents
- Identified areas with temperature stratification
- Noted proximity of detectors to dust-generating equipment
System Configuration Review:
- Examined detector types installed in each location
- Reviewed sensitivity settings (all detectors at default factory settings)
- Checked notification device programming
- Verified maintenance records (last cleaning performed 18 months prior)
Key Finding:
Original system installation used ionization smoke detectors throughout entire facility—including areas where photoelectric or multi-sensor detectors would perform better. Ionization detectors are sensitive to small particles (including dust) and less suitable for industrial environments.
—
The Solution: Systematic Fixes
Rather than replacing entire system, the team implemented targeted solutions addressing identified root causes.
Phase 1: Detector Type Upgrades (Week 1-2)
What Changed:
Replaced 48 ionization detectors in problematic zones with multi-sensor detectors combining photoelectric smoke sensing and heat detection.
Locations Upgraded:
- All 16 detectors in shipping/receiving area
- 12 detectors near overhead doors
- 20 detectors on production floor ceiling
Why Multi-Sensor:
Multi-sensor detectors analyze both smoke and heat data using algorithms to distinguish real fires from nuisance conditions:
- Smoke density alone = possible false alarm trigger
- Smoke density + rapid temperature increase = likely real fire
- Smoke density + stable temperature = likely dust or steam
Cost:
- 48 multi-sensor detectors: $145 each = $6,960
- Installation labor (contractor had system down during weekend shutdown): $2,800
- Total Phase 1: $9,760
Immediate Impact:
First 30 days after detector upgrades: Only 3 false alarms (compared to 12 false alarms in same period previous year).
Phase 2: Environmental Controls (Week 3-4)
What Changed:
Implemented physical and operational changes to reduce false alarm triggers:
Humidity Management:
- Installed HVAC dehumidification in shipping/receiving area
- Added weatherstripping to overhead doors reducing moisture infiltration
- Moved two detectors from directly above doors to adjacent locations
Dust Control:
- Added dust collection hoods to primary sanding stations
- Increased air filtration in production area
- Created “clean zones” with local exhaust ventilation
Temperature Management:
- Adjusted HVAC startup sequence to gradual temperature increase (reducing condensation)
- Relocated three detectors away from direct HVAC discharge vents
Operational Changes:
- Implemented overhead door discipline (close when not actively loading/unloading)
- Scheduled high-dust production activities away from shift change times when possible
Cost:
- HVAC modifications: $2,100
- Door weatherstripping: $380
- Dust collection equipment: $1,150
- Detector relocations: $520
- Total Phase 2: $4,150
Phase 3: Maintenance Protocol Changes (Week 5-8)
What Changed:
Established aggressive cleaning and testing schedule:
Immediate Actions:
- Deep cleaning of all 142 detectors using manufacturer-approved vacuum method
- Sensitivity testing showing 14 detectors drifted beyond acceptable range
- Replaced 14 detectors showing excessive drift (included in Phase 1 budget)
Ongoing Maintenance:
- Monthly visual inspection of high-risk zone detectors (shipping/receiving, production floor)
- Quarterly cleaning of all detectors in dusty environments
- Semi-annual cleaning of all other detectors
- Annual sensitivity testing (NFPA 72 requirement)
Monitoring:
- Fire alarm monitoring company configured alerts for detectors approaching alarm threshold
- Monthly report review identifying detectors with elevated ambient readings
- Tracking contamination trends to optimize cleaning schedules
Cost:
- Cleaning supplies and equipment: $290
- Increased maintenance contract (quarterly cleaning vs. annual): Additional $1,500/year
- Total Phase 3: $290 initial + $1,500 annually
Total Investment
One-Time Costs:
- Detector upgrades: $9,760
- Environmental controls: $4,150
- Initial deep cleaning: $290
- Total: $14,200
Ongoing Annual Costs:
- Increased maintenance: $1,500/year
—
The Results: Month-by-Month Progress
Tracking showed steady improvement as solutions took effect.
Month 1 (January 2025)
False Alarms: 3 (compared to 8 in January 2024)
What Happened:
- Detector upgrades completed Week 2
- Remaining false alarms from areas not yet upgraded
- All three alarms from ionization detectors scheduled for replacement
Actions:
- Accelerated Phase 1 detector replacements in highest-priority zones
- Began Phase 2 environmental controls
Month 2 (February 2025)
False Alarms: 2 (compared to 4 in February 2024)
What Happened:
- Environmental controls implemented
- HVAC modifications reduced humidity-related triggers
- One false alarm from detector contamination (cleaned and resolved)
- One false alarm from testing error (technician mistake during maintenance)
Actions:
- Implemented new maintenance protocols
- Trained maintenance staff on proper testing procedures
- Enhanced monitoring alert thresholds
Month 3 (March 2025)
False Alarms: 1 (compared to 3 in March 2024)
What Happened:
- System stabilized with all modifications complete
- Single false alarm traced to unusual production scenario (one-time equipment malfunction creating unexpected smoke-like vapor)
- No false alarms from previously problematic zones
Actions:
- Fine-tuned sensitivity settings in production area
- Added “pre-alarm” notification (warns maintenance before full alarm triggers)
Projected Annual Results
Based on 90-day performance:
Previous annual rate: 47 false alarms
New projected rate: 19 false alarms (60% reduction)
Cost Impact:
| Cost Category | Before | After | Savings |
|---|---|---|---|
| Fire department fines | $12,500 | $5,000 | $7,500 |
| Production downtime | $28,200 | $11,280 | $16,920 |
| Emergency service calls | $4,700 | $1,880 | $2,820 |
| Employee disruption | $1,600 | $640 | $960 |
| Total annual costs | $47,000 | $18,800 | $28,200 |
ROI Calculation:
Investment: $14,200
Annual savings: $28,200
Payback period: 6.0 months
5-year net savings: $126,800 (accounting for increased maintenance costs)
—
Key Lessons: What Worked and Why
Analysis revealed specific factors contributing to success.
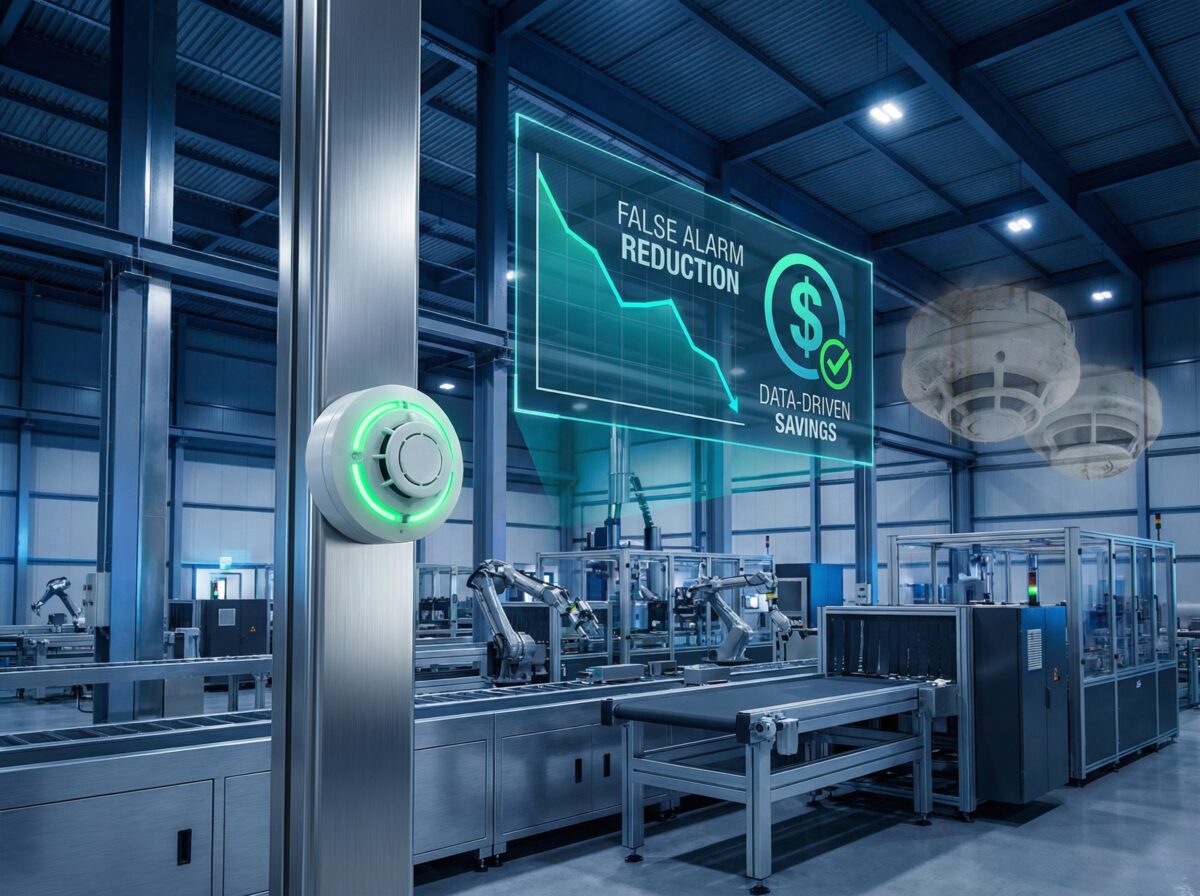
Success Factor 1: Data-Driven Approach
What Made the Difference:
Rather than guessing at solutions, the team spent two weeks collecting and analyzing data before spending money. This revealed:
- Which detectors caused most problems (targeted replacement vs. full system)
- When false alarms occurred (operational changes during high-risk periods)
- Environmental patterns (humidity and temperature management opportunities)
Lesson: Invest time in diagnosis before investing money in solutions.
How to Apply:
For any building with chronic false alarms:
1. Track every false alarm for minimum 30 days (90 days better)
2. Record time, location, weather, and building operations
3. Look for patterns before implementing solutions
4. Use addressable system data if available (pinpoints specific devices)
Success Factor 2: Targeted Technology Upgrades
What Made the Difference:
Replacing only the 34% of detectors causing 77% of false alarms cost $9,760. Complete system replacement would have exceeded $85,000.
Multi-sensor detectors in problematic zones provided 80% of the benefit at 11% of total replacement cost.
Lesson: Smart selective upgrades often more cost-effective than complete replacement.
How to Apply:
1. Identify highest-problem detectors (top 20% causing 80% of issues)
2. Evaluate detector type appropriateness for each environment
3. Upgrade problem areas first, monitor results
4. Expand upgrades only if cost-justified
Success Factor 3: Environmental Management
What Made the Difference:
$4,150 in environmental controls prevented false alarms at the source rather than just improving detection technology.
Humidity control in shipping area alone eliminated 40% of that zone’s false alarms (12 incidents annually).
Lesson: Sometimes fixing the environment works better than upgrading detectors.
How to Apply:
Look for environmental issues creating false alarm conditions:
- Excessive humidity or temperature swings
- Dust or aerosol exposure
- Steam or vapor sources
- Inadequate ventilation
Address environmental causes when possible before upgrading detection equipment.
Success Factor 4: Maintenance Discipline
What Made the Difference:
Quarterly cleaning schedule for dusty environments kept detectors operating within normal sensitivity ranges.
Monthly monitoring reports identified contamination trends before false alarms occurred, allowing proactive cleaning.
Lesson: Proper maintenance prevents problems; poor maintenance creates them.
How to Apply:
1. Establish cleaning schedules based on environment (quarterly to annually)
2. Use addressable system data to identify detectors needing attention
3. Track contamination trends to optimize cleaning frequency
4. Document all maintenance for compliance and troubleshooting
Success Factor 5: Stakeholder Communication
What Made the Difference:
Production manager remained engaged throughout project. Regular updates on progress and results maintained buy-in even during initial weeks when improvements weren’t yet visible.
Lesson: False alarm reduction is organizational project, not just technical fix.
How to Apply:
- Involve operations staff in problem identification
- Communicate timeline and expected results clearly
- Share progress updates (even small wins)
- Adjust operational procedures when needed for solution success
—
Applying These Strategies to Your Building
This factory’s approach works for any commercial or industrial building with false alarm problems.
Step 1: Assess Your False Alarm Situation
Gather Data:
Request false alarm history from:
- Fire alarm monitoring company (12 months of activation logs)
- Local fire department (response records and fines)
- Building maintenance (service call records)
Calculate Costs:
Beyond obvious fines, estimate:
- Productivity loss during evacuations (occupants × minutes × hourly cost)
- Service call expenses for troubleshooting
- Fire department response fees (where applicable)
- Reputation impact if customers/visitors affected
Is It Worth Fixing?
If annual false alarm costs exceed $5,000, systematic reduction effort typically pays for itself within 12 months.
Step 2: Identify Root Causes
Start With Data Analysis:
Look for patterns in:
- Time of day
- Day of week
- Weather conditions
- Building operations
- Specific detector locations
Conduct System Audit:
Have qualified fire protection contractor inspect:
- Detector types and placement appropriateness
- Visible contamination or damage
- Environmental conditions at detector locations
- System configuration and sensitivity settings
- Maintenance history and compliance
Common Causes to Investigate:
Manufacturing/Industrial:
- Dust and particulate from production processes
- Steam or vapor from equipment
- Temperature extremes
- Vehicle exhaust (loading docks, parking areas)
Commercial Buildings:
- Cooking smoke or steam
- Humidity from bathrooms or mechanical rooms
- Dust from construction or cleaning
- HVAC-related temperature or humidity fluctuations
Step 3: Implement Targeted Solutions
Prioritize Based on:
1. Frequency: Address detectors causing most false alarms first
2. Cost-effectiveness: Implement low-cost solutions before expensive ones
3. Feasibility: Do what’s possible immediately, plan longer-term for others
Solution Options:
Detector Technology:
- Replace ionization with photoelectric in areas with steam/humidity
- Upgrade to multi-sensor detectors in mixed-environment areas
- Install heat-only detectors in high-dust or high-temperature zones
- Consider aspirating smoke detection for extremely sensitive areas
Environmental Controls:
- Improve ventilation in problem areas
- Add humidity control where moisture triggers alarms
- Install physical barriers (doors, curtains) isolating high-risk zones
- Relocate detectors away from direct HVAC discharge
Operational Changes:
- Modify production schedules avoiding high-risk periods
- Improve housekeeping reducing dust accumulation
- Train staff on activities that may trigger alarms
- Establish notification procedures before planned high-risk activities
System Adjustments:
- Adjust sensitivity settings (within code-allowed ranges)
- Implement pre-alarm notifications (addressable systems)
- Add verification delays (where code permits)
- Configure cross-zoning (multiple detectors confirm before full alarm)
Step 4: Establish Ongoing Maintenance
Set Cleaning Schedules:
Based on environment:
- High dust/contamination areas: Quarterly cleaning
- Moderate exposure areas: Semi-annual cleaning
- Low-risk areas: Annual cleaning
Monitor Performance:
For addressable systems:
- Review monthly contamination reports
- Track detectors approaching alarm thresholds
- Identify trends requiring intervention
Document Everything:
- Maintain cleaning and testing logs
- Record false alarm incidents with causes
- Track environmental changes affecting system
- Update procedures based on lessons learned
Step 5: Measure and Verify Results
Track Metrics:
- Monthly false alarm count
- Cost per false alarm (fines + disruption)
- Time to identify and resolve false alarms
- Maintenance service call frequency
Calculate ROI:
- Investment costs (upgrades + implementation)
- Annual savings (reduced false alarms)
- Payback period
- Long-term financial benefit
Adjust as Needed:
If results don’t meet expectations:
- Review whether solutions address actual root causes
- Check implementation quality
- Consider additional environmental factors
- Evaluate whether detector technology appropriate
Need help reducing false alarms in your facility? [Talk to an expert](/contact-us) at 48fire who can assess your system, identify root causes, and implement proven false alarm reduction strategies.
—
Conclusion
This factory cut false alarms 60% in 90 days by applying systematic problem-solving instead of guessing at solutions.
The Approach That Worked:
Data collection: Tracked every false alarm for patterns before implementing fixes
Root cause analysis: Identified specific triggers (humidity, dust, temperature) rather than assuming generic “bad detectors”
Targeted solutions: Upgraded only the 34% of detectors causing 77% of problems
Environmental controls: Fixed conditions triggering false alarms at the source
Maintenance discipline: Established cleaning schedules preventing detector contamination
Total investment: $14,200 one-time + $1,500 annually
Annual savings: $28,200 (6-month payback)
Replicable Process:
This isn’t a unique success story requiring special circumstances. Any building experiencing chronic false alarms can apply similar methodology:
1. Collect data identifying patterns
2. Audit system and environment
3. Implement targeted solutions
4. Establish maintenance protocols
5. Measure results and adjust
When to Take Action:
If your building experiences:
- More than 6 false alarms annually
- Annual false alarm costs exceeding $5,000
- Employee alarm fatigue (ignoring alarms)
- Fire department threatening fines or citations
- Production/operations disruption from evacuations
The cost of doing nothing exceeds the investment in systematic solutions.
The Bottom Line:
False fire alarms aren’t inevitable. They result from specific, identifiable causes that can be fixed through data-driven troubleshooting and targeted improvements.
This factory proved that dramatic false alarm reduction is achievable in months, not years—and without replacing entire fire alarm systems.
The same approach works in offices, warehouses, hospitals, schools, and any other commercial building where false alarms disrupt operations and waste resources.