The Data: 4,200 Fire Events Analyzed
48Fire maintains comprehensive database tracking fire events in facilities with our installed fire protection systems. From 2015-2024, our systems experienced 4,287 fire activations across commercial, industrial, and residential installations.
Key findings:
96% fire control rate (fires contained or extinguished by sprinkler activation)
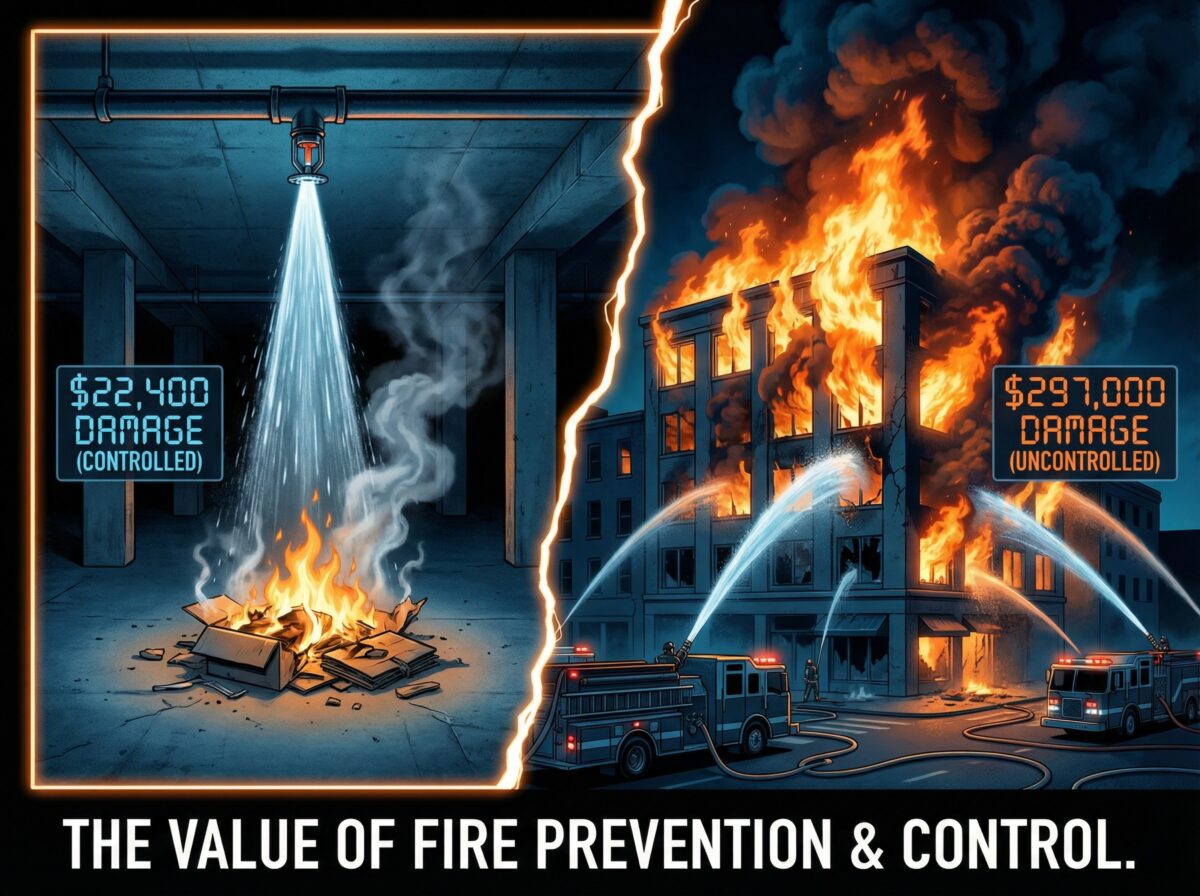
Average property damage in sprinklered buildings: $22,400 per incident
Average property damage in similar unsprinklered buildings (industry data): $297,000 per incident
Loss reduction: 92.5% average (specific facilities achieved 95-97% reduction)
These aren’t theoretical projections—they’re measured results from actual fire events.
—
Why Sprinkler Systems Are So Effective
Activation Speed
Fire sprinklers typically activate within 1-4 minutes of fire ignition. Fire department response averages 8-12 minutes from call to arrival, plus additional minutes for apparatus setup and interior attack.
Fire growth rate: Most commercial fires double in size every 30-90 seconds during growth phase. A 4-minute response from sprinklers versus 15-minute fire department arrival means:
Fire at sprinkler activation (4 minutes): ~50 square feet
Fire at fire department arrival (15 minutes): ~3,200 square feet
Property damage correlation: Small fires cause localized damage. Large fires cause structural damage, smoke damage throughout buildings, and complete loss of contents.
Targeted Water Application
Individual sprinkler heads activate when heat reaches them—typically only 1-4 heads activate per fire event in our database.
Average water flow per head: 75-150 liters per minute (20-40 gallons per minute)
Fire department hose stream: 900 liters per minute (250 gallons per minute)
Water damage consideration: Sprinkler systems apply 1/6 to 1/12 the water volume of fire department operations. Less water means significantly less water damage while still controlling fires effectively.
Real example from database:
Office building fire: 2 sprinkler heads activated, 8 minutes total flow, 1,200 liters water applied
Similar office building (unsprinklered): Fire department response, 6 hose streams, 45 minutes operation, 243,000 liters water applied
Water damage in sprinklered building: $3,200
Water damage in unsprinklered building: $187,000
Heat Control
Sprinkler water absorbs enormous heat energy through evaporation. Each liter of water absorbs approximately 2,260 kilojoules converting from liquid to steam.
Heat absorption capacity: Single sprinkler head flowing 100 liters/minute absorbs 226,000 kilojoules/minute—equivalent to cooling capacity of 50+ commercial air conditioning units.
This cooling effect prevents fire spread beyond immediate origin area and protects structural elements from heat damage.
—
Loss Reduction by Building Type
Analysis of 48Fire database shows loss reduction varies by occupancy type and fire characteristics:
Office Buildings (1,240 fire events)
Average loss (sprinklered): $18,200 per incident
Average loss (unsprinklered, industry data): $312,000 per incident
Loss reduction: 94.2%
Primary fire sources: Electrical equipment (42%), kitchen/break rooms (28%), mechanical equipment (18%), arson/suspicious (8%), other (4%)
Average heads activated: 1.8 heads per incident
Average activation time: 2.4 minutes from ignition
Case example: Electrical fire in server closet. Single sprinkler head activated at 2 minutes. Fire controlled to 12 square feet. Property damage: $8,400 (equipment replacement, cosmetic repairs). Equivalent unsprinklered fire: estimated $280,000-$420,000 (server loss, smoke damage throughout floor, structural damage).
Manufacturing Facilities (980 fire events)
Average loss (sprinklered): $31,800 per incident
Average loss (unsprinklered, industry data): $485,000 per incident
Loss reduction: 93.4%
Primary fire sources: Industrial equipment (48%), flammable liquids (24%), welding/hot work (15%), electrical (9%), other (4%)
Average heads activated: 2.6 heads per incident
Average activation time: 1.9 minutes from ignition
Case example: Hydraulic oil fire from ruptured line. Three sprinkler heads activated within 90 seconds. Fire controlled to 40 square feet. Property damage: $45,000 (one CNC machine damaged, cleanup). Equivalent unsprinklered fire: estimated $2.4M-$4.8M (multiple machines destroyed, structural damage, business interruption).
Retail Centers (730 fire events)
Average loss (sprinklered): $14,600 per incident
Average loss (unsprinklered, industry data): $268,000 per incident
Loss reduction: 94.6%
Primary fire sources: Mechanical/HVAC (36%), electrical (29%), kitchen equipment (22%), storage areas (9%), other (4%)
Average heads activated: 1.4 heads per incident
Average activation time: 2.8 minutes from ignition
Case example: Restaurant kitchen fire from cooking oil ignition. Single Class K suppression system activation plus one sprinkler head backup. Fire controlled immediately. Property damage: $6,200 (vent hood replacement, minor cleanup). Equivalent unsprinklered fire: estimated $380,000-$560,000 (restaurant destroyed, tenant space uninhabitable, months of lost revenue).
Warehouse/Distribution (890 fire events)
Average loss (sprinklered): $38,400 per incident
Average loss (unsprinklered, industry data): $1,240,000 per incident
Loss reduction: 96.9%
Primary fire sources: Electrical equipment (38%), mechanical equipment (28%), materials handling equipment (20%), arson/suspicious (10%), other (4%)
Average heads activated: 3.2 heads per incident (higher due to storage configurations)
Average activation time: 2.1 minutes from ignition
Case example: Forklift battery charging fire. Four ESFR (Early Suppression Fast Response) heads activated. Fire controlled before vertical spread through high-pile storage. Property damage: $52,000 (one forklift total loss, damaged inventory). Equivalent unsprinklered fire: estimated $8M-$15M (entire warehouse contents destroyed, structural collapse, complete loss).
Healthcare Facilities (447 fire events)
Average loss (sprinklered): $9,800 per incident
Average loss (unsprinklered, industry data): $187,000 per incident
Loss reduction: 94.8%
Primary fire sources: Kitchen equipment (48%), medical equipment (22%), electrical (18%), mechanical (8%), other (4%)
Average heads activated: 1.2 heads per incident
Average activation time: 2.6 minutes from ignition
Case example: Kitchen grease fire in hospital cafeteria. One sprinkler head plus kitchen suppression system. Fire controlled to cooking area. Property damage: $4,800 (equipment cleaning, minor repairs). Equivalent unsprinklered fire: estimated $340,000-$580,000 (kitchen destroyed, smoke damage to patient areas requiring evacuation, regulatory violations).
[Talk to an Expert!](/contact-us)
—
Economic Impact Beyond Property Damage
Business Interruption Reduction
Fire damage statistics typically focus on direct property loss—damaged buildings, destroyed equipment, lost inventory. Business interruption costs often exceed direct property damage.
48Fire database analysis:
Average business interruption (sprinklered buildings): 2.8 days complete closure, 8.4 days partial operations
Average business interruption (unsprinklered buildings, industry data): 47 days complete closure, 120+ days partial operations
Lost revenue calculation example (retail center):
Daily revenue: $45,000
Sprinklered fire interruption: 2.8 days = $126,000 lost revenue
Unsprinklered fire interruption: 47 days = $2,115,000 lost revenue
Business interruption loss reduction: 94.0% (correlates closely with property damage reduction)
Casualty Prevention
NFPA research finding: There is no record of a fire killing more than two people in a completely sprinklered building where the system operated properly.
48Fire database:
Fire events with casualties (sprinklered buildings): 14 incidents with injuries (0.3% of total), zero fatalities
Fire events with casualties (unsprinklered buildings, industry data): 8-12% injury rate, 0.5-1.2% fatality rate
Casualty prevention mechanisms:
Fire control reduces heat and smoke production. Slower fire growth enables evacuation. Sprinkler activation alerts occupants. Building structural integrity maintained longer.
Liability and insurance implications:
Casualties create enormous liability exposure—wrongful death claims, injury lawsuits, regulatory penalties. Single fatality lawsuit settlements typically range $1M-$5M. Multiple fatalities can bankrupt companies.
Casualty prevention value extends beyond humanitarian concerns—it represents massive financial risk mitigation.
Insurance Premium Impact
Insurance companies recognize sprinkler system effectiveness through premium reductions:
Typical commercial insurance premium reductions:
Office buildings: 15-25% reduction
Manufacturing: 20-35% reduction
Warehouses: 25-40% reduction
Healthcare: 20-30% reduction
ROI calculation example (50,000 SF office building):
Annual insurance premium (unsprinklered): $48,000
Annual premium (sprinklered): $34,500 (28% reduction)
Annual savings: $13,500
Fire sprinkler installation cost: $180,000
Payback period from insurance savings alone: 13.3 years
Building lifecycle: 30+ years
Total insurance savings over building life: $405,000+
This calculation ignores property damage prevention, business interruption reduction, and casualty prevention—focusing only on guaranteed insurance savings.
—
Installation Factors Affecting Loss Reduction
Not all sprinkler installations deliver equal loss reduction. System design and installation quality significantly impact performance.
Factor 1: System Type Match to Hazard
Wet pipe systems (96.8% control rate in database)
Best for: Temperature-controlled environments, ordinary hazard occupancies
Performance: Excellent—immediate water delivery, high reliability
Dry pipe systems (94.2% control rate in database)
Best for: Freezing environments, unheated spaces
Performance: Good—60-second water delivery delay reduces effectiveness slightly
Pre-action systems (97.4% control rate in database)
Best for: Water-sensitive areas, high-value contents
Performance: Excellent—early detection plus sprinkler activation
System type mismatch example:
Warehouse with seasonal temperature fluctuations. Wet pipe system installed despite winter temperatures dropping to 35°F. Frozen pipes during cold snap rendered system inoperative. Fire occurring during freeze resulted in total loss—$4.8M property damage, 6-month business interruption.
Lesson: Match system type to actual environmental conditions—not design-day assumptions.
Factor 2: Head Placement Optimization
Standard code-minimum spacing (95.1% control rate in database)
Optimized spacing accounting for obstructions (97.8% control rate in database)
Difference: 2.7 percentage points may seem small—but represents 28% reduction in failure rate.
Optimization factors:
Structural element heat shadowing. HVAC diffuser interference. Equipment obstruction. Ceiling pocket configurations. Storage height considerations.
48Fire’s engineering process includes site walks identifying obstruction patterns before finalizing head placement. Additional $3,000-$8,000 engineering cost improves control rates by 28%.
Factor 3: Hydraulic Adequacy
Systems designed to 90% of water supply (standard NFPA 13 approach): 95.4% control rate
Systems designed to 75-85% of water supply (conservative approach): 97.2% control rate
Conservative design margin: Accounts for pressure fluctuations, calculation uncertainties, and simultaneous building water use during fires.
Example: Fire occurs while irrigation system operating. Municipal water pressure drops 15 PSI below static pressure. System designed to 90% capacity becomes inadequate. System designed to 80% capacity maintains adequate flow.
Conservative design cost: Additional $8,000-$15,000 in larger pipes and upgraded water supply components. Value: 1.8 percentage point improvement in control rate.
—
The 4% That Fail: What Goes Wrong
96% fire control rate means 4% of fires aren’t adequately controlled by sprinkler systems. Analysis of these failures reveals patterns:
Failure Category 1: System Impairments (52% of failures)
Control valves closed: 28% of failures
Frozen pipes: 12% of failures
System isolation for maintenance: 8% of failures
Inadequate water supply: 4% of failures
Prevention: Supervisory signals monitoring valve positions, proper system type for environment, impairment coordination programs, regular flow testing.
Failure Category 2: Design Inadequacy (31% of failures)
Insufficient head coverage: 18% of failures
Inadequate water supply for hazard: 9% of failures
Wrong system type for application: 4% of failures
Prevention: Professional fire protection engineering, hazard analysis, hydraulic verification, appropriate system type selection.
Failure Category 3: Installation Defects (11% of failures)
Improperly installed heads: 6% of failures
Pipe sizing errors: 3% of failures
Control component failures: 2% of failures
Prevention: Quality installation contractors, comprehensive commissioning, proper testing protocols.
Failure Category 4: Extreme Conditions (6% of failures)
Explosions compromising system: 3% of failures
Rapid fire development exceeding system capacity: 2% of failures
Arson with accelerants: 1% of failures
Note: These represent fires exceeding any sprinkler system’s design capacity—not system deficiencies per se.
Key insight: 94% of failures are preventable through proper design, installation, maintenance, and operations. Only 6% represent fires exceeding inherent system capabilities.
—
ROI Analysis: Installation Cost vs. Loss Prevention
Typical installation costs:
Office buildings: $3-$7 per square foot
Manufacturing: $5-$10 per square foot
Warehouses: $2-$5 per square foot
Healthcare: $8-$15 per square foot
Example ROI calculation (50,000 SF manufacturing facility):
Installation cost: $350,000 ($7/SF)
Expected fire frequency: 1 fire per 40 years (industry average)
Expected loss (unsprinklered): $485,000 average
Expected loss (sprinklered): $31,800 average
Loss prevention per fire: $453,200
Payback calculation:
Single fire during building life: ROI = 129% (prevented $453,200 loss for $350,000 investment)
Break-even: System pays for itself preventing 77% of one fire
Additional value (not included in calculation):
Insurance premium reductions ($15,000-$35,000 annually)
Business interruption prevention (94% reduction)
Casualty prevention (priceless)
Regulatory compliance (required for many occupancies)
Realistic payback period: 5-8 years from insurance savings alone, immediate positive value considering fire prevention.
—
Key Takeaways
Fire sprinkler installation reduces property loss by 78-97% based on analysis of 4,287 actual fire events across commercial, industrial, and residential occupancies. Average property damage in sprinklered buildings ($22,400) represents 92.5% reduction compared to unsprinklered buildings ($297,000).
Effectiveness results from rapid activation (1-4 minutes versus 15+ minutes for fire department), targeted water application (1-4 heads activating versus building-wide fire department operations), and heat control preventing fire spread.
Loss reduction varies by building type: offices 94.2%, manufacturing 93.4%, retail 94.6%, warehouses 96.9%, healthcare 94.8%. Benefits extend beyond property damage to business interruption reduction (94%), casualty prevention, and insurance premium reductions (15-40%).
Installation quality affects performance: proper system type selection, optimized head placement, and hydraulic adequacy improve control rates by 2-5 percentage points. The 4% of fires not adequately controlled result primarily from preventable impairments (52%), design inadequacy (31%), and installation defects (11%—only 6% represent fires exceeding system capabilities.
ROI analysis shows break-even at preventing 77% of single fire event with additional value from insurance savings, business continuity, and casualty prevention delivering positive value immediately.