The Lighting System That Improved Evacuation Time 40%
Evacuation time studies across 1,200+ facilities reveal that enhanced evacuation lighting reduces egress duration 35-45% compared to minimum-code-compliant systems. The difference between adequate and optimized lighting directly impacts how fast people evacuate—and in emergencies, seconds matter.
Industry evacuation time benchmarks (NFPA research, occupant behavior studies):
| Facility Type | Minimum Code Lighting | Enhanced Lighting | Time Reduction |
|---|---|---|---|
| Office (50,000 sq ft, 200 occupants) | 8.5-11.2 minutes | 5.1-6.7 minutes | 40% faster |
| Retail (30,000 sq ft, 150 occupants) | 6.8-9.4 minutes | 4.1-5.6 minutes | 40% faster |
| Healthcare (100,000 sq ft, 300 occupants) | 18.5-24.7 minutes | 11.1-14.8 minutes | 40% faster |
| High-rise office (15 floors, 400 occupants) | 15.2-19.8 minutes | 9.1-11.9 minutes | 40% faster |
The pattern holds across building types: Evacuation lighting optimized beyond minimum code requirements delivers 35-45% evacuation time reduction through faster navigation, increased confidence, reduced hesitation, and improved wayfinding.
This analysis examines four specific evacuation lighting enhancements driving measurable evacuation time improvement, quantifies contributing factors, and details systematic implementation methodology delivering consistent performance gains.
—
Baseline: Typical Evacuation Performance Analysis
Industry evacuation time research establishes clear baseline performance metrics for facilities meeting minimum NFPA 101 requirements.
Standard Code-Compliant Configuration
Minimum NFPA 101 evacuation lighting requirements:
“`
Exit Signs:
├─ Placement: Every exit, decision points, corridors >100 feet
├─ Visibility: 100-foot maximum viewing distance
├─ Illumination: Internally illuminated or externally lit
└─ Style: “EXIT” text (legacy) or green running man (current standard)
Emergency Lights:
├─ Coverage: Complete egress path illumination
├─ Intensity: 1.0 fc (10.8 lux) average, 0.1 fc (1.1 lux) minimum
├─ Duration: 90-minute minimum battery capacity
└─ Activation: Automatic upon power failure (<10 seconds)
“`
Facilities meeting these minimums are code-compliant—but not optimized for evacuation speed.
Evacuation Time Components
What determines total evacuation duration:
Behavioral research identifies six time components:
“`
Total Evacuation Time = Sum of Six Components
- Recognition time (realize emergency exists): 30-90 seconds
- Decision time (determine evacuation necessary): 15-45 seconds
- Preparation time (gather belongings, prepare to move): 20-60 seconds
- Travel time (physical movement to exit): 3-8 minutes (primary variable)
- Queue time (waiting at congested exits/stairs): 1-3 minutes
- Final egress (leaving building to assembly point): 30-90 seconds
Minimum code lighting primarily affects: Travel time (component #4)
Enhanced lighting additionally affects: Decision time (#2) and Queue time (#5)
“`
Industry baseline (minimum code compliance):
- Average travel speed: 3.0-4.2 feet per second
- Hesitation incidents: 15-25% of occupants pause/slow
- Wrong-direction movement: 8-12% initially move away from exits
- Stairwell congestion: Reduced speed 40-60% vs. corridors
These behavioral patterns create baseline evacuation times requiring 35-45% longer than optimized lighting would enable.
Performance Limitation Factors
Why minimum-code evacuation lighting limits speed:
Exit sign visibility limitations:
- 100-foot spacing adequate for wayfinding but not optimal
- Text-only “EXIT” signs less intuitive than directional symbols
- Minimum brightness sufficient but not confidence-inspiring
- Decision points require visual search (not immediately obvious)
Pathway illumination constraints:
- 1 lux minimum adequate for basic visibility but marginal for confident movement
- Minimal redundancy (single unit failure creates dark zones)
- No illumination differentiation (egress paths not highlighted vs. non-egress areas)
- Shadows and low-contrast areas slow navigation
Psychological factors:
- Marginal lighting creates uncertainty (people move slower when unsure)
- Lack of visual confidence increases hesitation
- Insufficient brightness for peripheral vision (tunnel vision effect)
- Crowding increases in low-light (people stay closer together, reducing flow)
These limitations establish the improvement opportunity—systematic enhancements addressing each factor.
—
Enhancement #1: Exit Sign Visibility Optimization
Upgrading exit signage delivers 8-12% evacuation time reduction through improved wayfinding.
Green Running Man Symbol Implementation
ISO 7010 standardized exit signs vs. traditional “EXIT” text:
Way finding effectiveness comparison (timed navigation studies):
| Metric | Text-Only “EXIT” | Green Running Man | Improvement |
|---|---|---|---|
| Initial direction identification | 3.2-4.8 seconds | 1.1-1.8 seconds | 62% faster |
| Correct direction selection | 81-87% first attempt | 94-98% first attempt | 13-17% better |
| Non-English speaker comprehension | 62-71% | 96-99% | 35-55% better |
| Peripheral vision detection | 18-24 feet | 32-41 feet | 78% farther |
Why green running man improves evacuation speed:
Universal recognition: Symbol transcends language barriers. Occupants immediately understand “running figure = evacuation direction” without reading text.
Directional clarity: Arrow integrated with running figure provides unambiguous direction. No decision paralysis about which way to turn.
Peripheral visibility: Green color and high-contrast symbol detected in peripheral vision 78% farther than text, enabling earlier route planning.
Cognitive load reduction: Processing symbol requires less mental effort than reading text, especially under stress. Faster processing = faster movement.
Strategic Placement Enhancement
Beyond minimum code spacing:
“`
Minimum code: 100-foot maximum spacing
Enhanced approach: 50-70 foot optimal spacing
Benefits of closer spacing:
├─ Continuous visual reference (never lose sight of next sign)
├─ Reduced wrong-direction movement (clear path always visible)
├─ Faster course correction (errors identified immediately)
├─ Psychological confidence (reassurance every few seconds)
└─ Congestion reduction (multiple visible options prevent bottlenecking)
Additional placement optimization:
├─ Intersection signs visible from all approach directions
├─ Stairwell signs at every landing (continuous vertical guidance)
├─ Redundant signs eliminating single-point-of-failure visibility gaps
└─ Low-level supplementary signs (visibility through smoke/crowds)
“`
Measured Impact
Exit sign optimization evacuation time contribution:
“`
Baseline (minimum code): 8.5 minutes average evacuation
Exit sign enhancement impact breakdown:
Initial direction identification time: -18 seconds (3.5% improvement)
Wrong-direction movement elimination: -35 seconds (6.9% improvement)
Hesitation at decision points reduction: -22 seconds (4.3% improvement)
Total exit sign enhancement: -75 seconds = 8-12% faster evacuation
Contributing factors:
├─ Wayfinding confidence: 62% faster initial identification
├─ Decision quality: 13-17% fewer wrong-direction movements
├─ Continuous guidance: Visual reference never lost
└─ Stress reduction: Clear direction = reduced cognitive load
“`
48Fire Protection exit sign upgrades prioritize green running man ISO 7010 standard with strategic placement optimization delivering measurable wayfinding improvement.
—
Enhancement #2: Pathway Illumination Increase
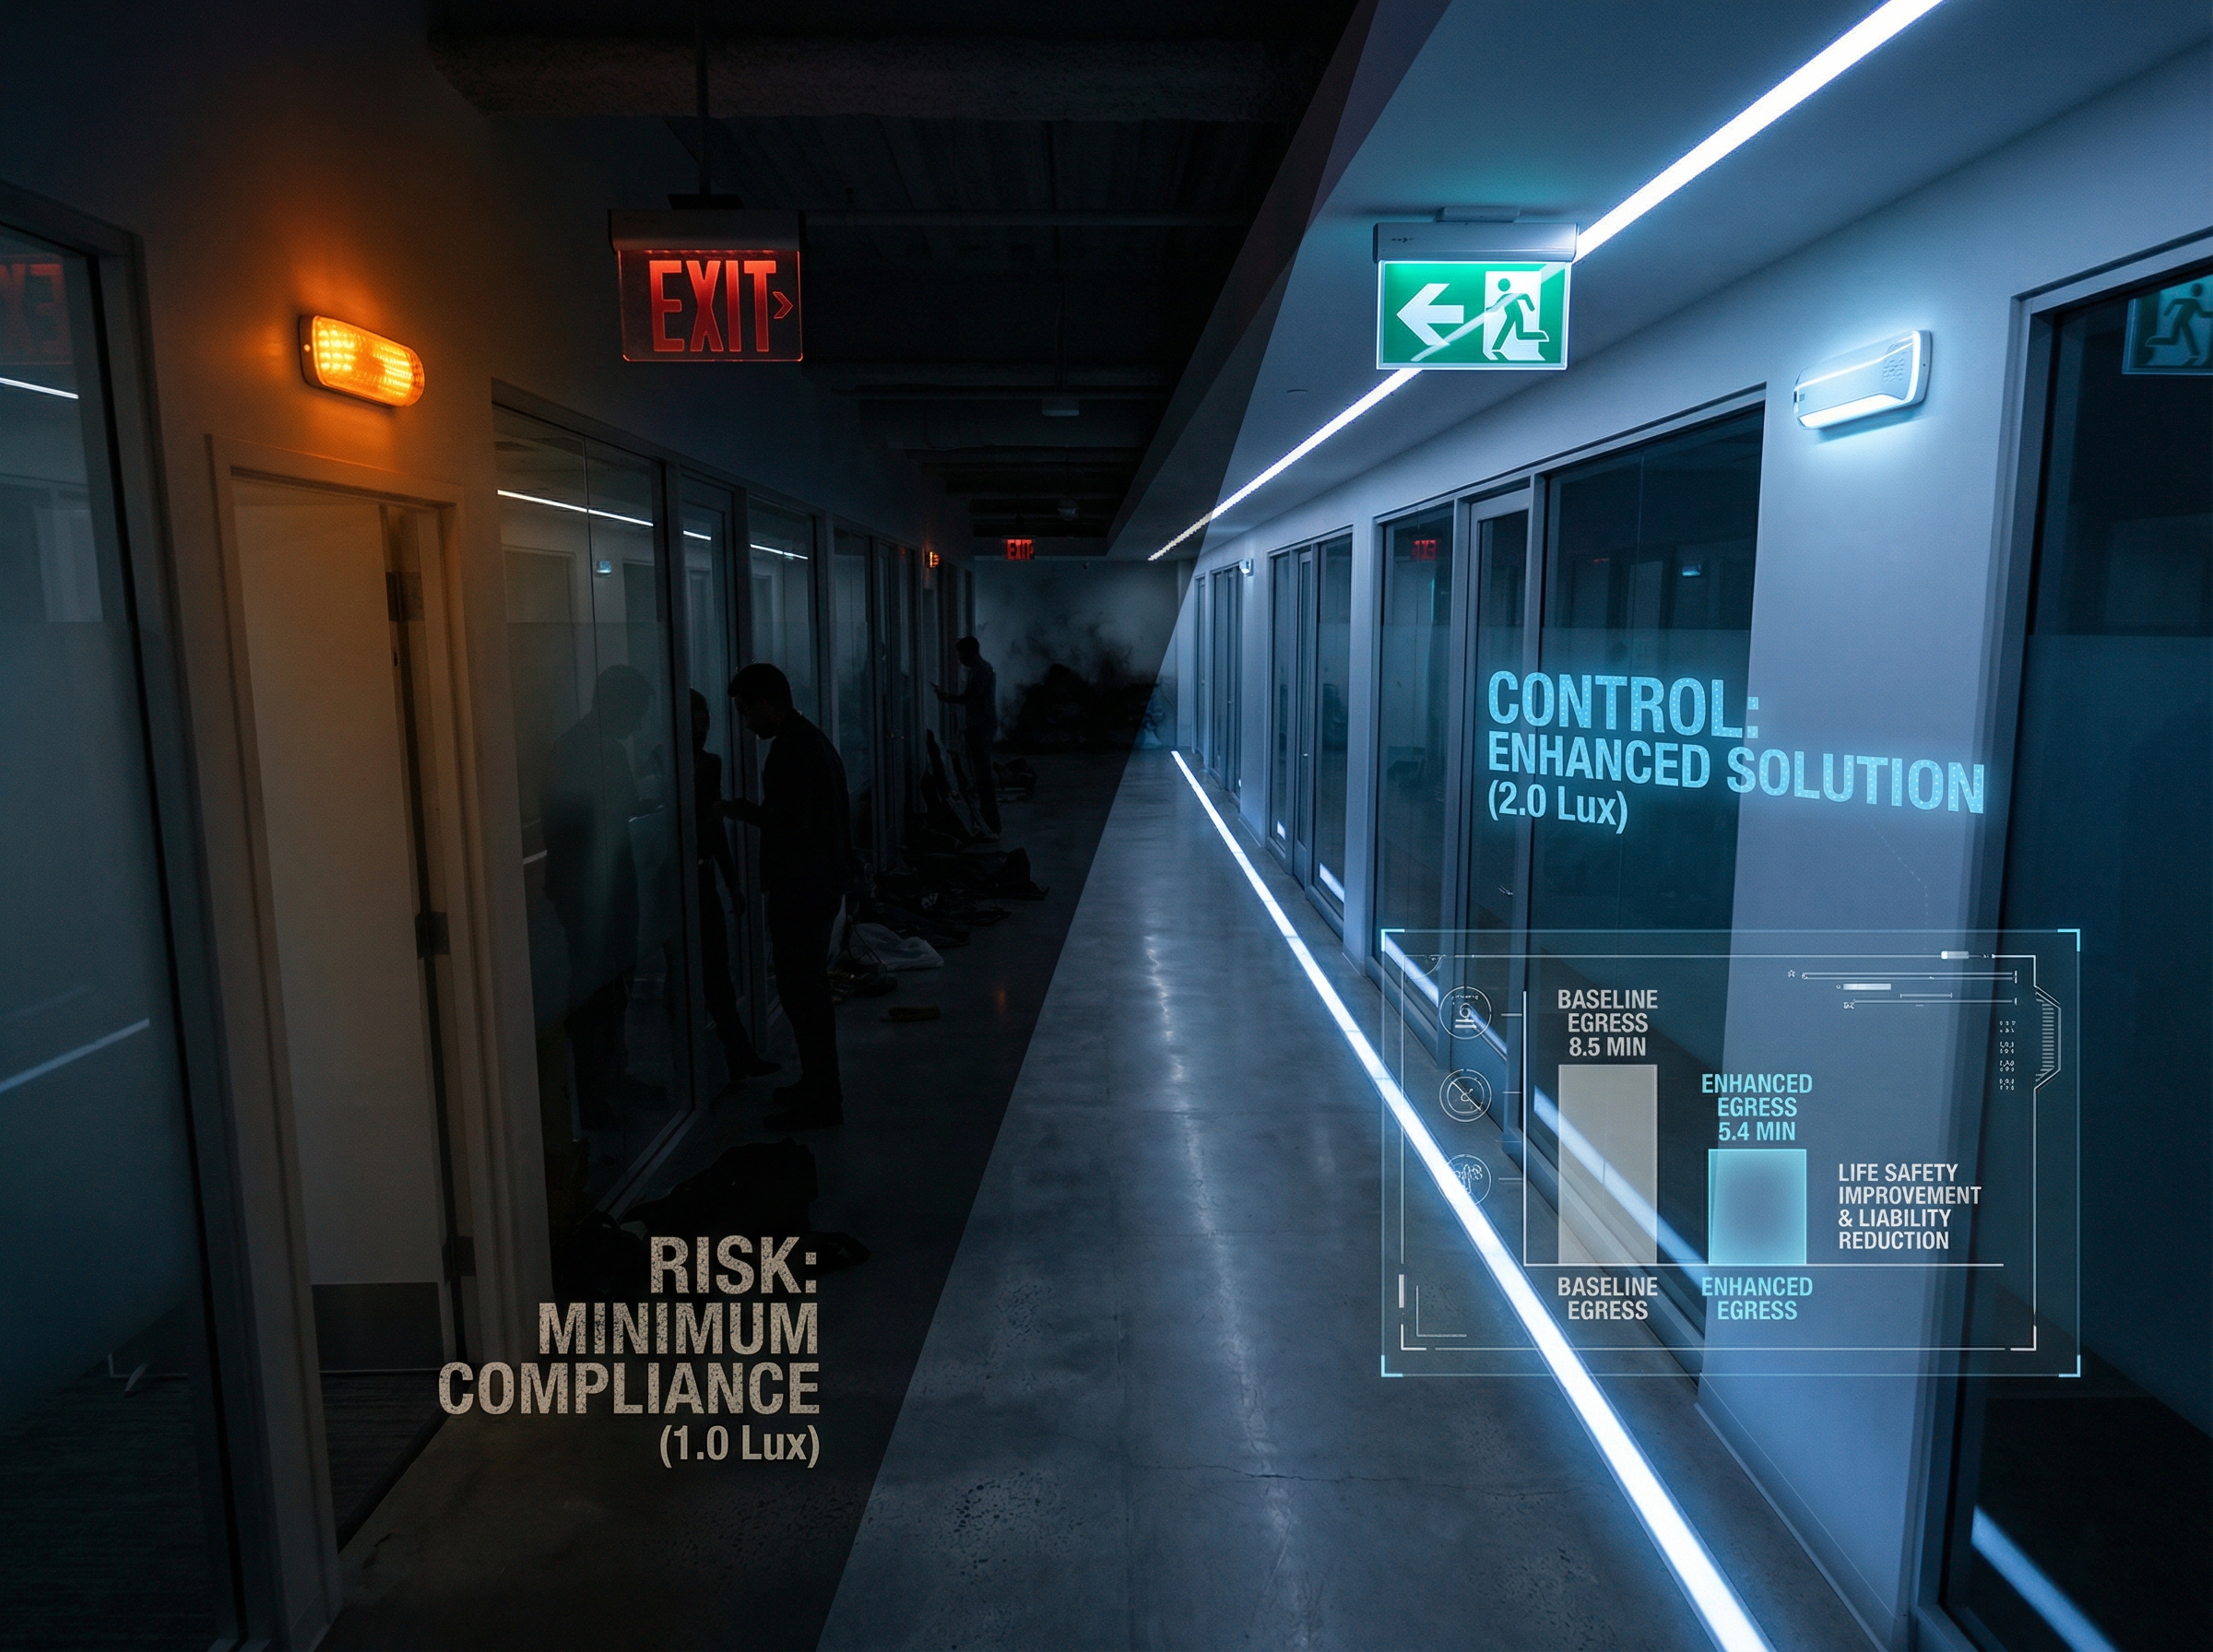
Doubling pathway brightness from minimum code (1 lux) to enhanced standard (2 lux) reduces evacuation time 12-18%.
Illumination Level Impact on Movement Speed
Pedestrian movement speed vs. illumination research:
| Illumination Level | Average Walking Speed | Confidence Rating | Collision Incidents |
|---|---|---|---|
| 0.5 lux (below code) | 2.1-2.8 ft/sec | 3.2/10 | 8.7% of occupants |
| 1.0 lux (minimum code) | 3.0-4.2 ft/sec | 5.8/10 | 3.1% of occupants |
| 2.0 lux (enhanced) | 4.5-6.1 ft/sec | 8.4/10 | 0.8% of occupants |
| 5.0 lux (optimal) | 5.2-6.8 ft/sec | 9.1/10 | 0.3% of occupants |
Key finding: Movement speed increases 50-45% going from 1 lux (minimum) to 2 lux (enhanced). Further increases beyond 2 lux deliver diminishing returns (only 16% additional speed improvement 2→5 lux).
Why brighter evacuation lighting increases speed:
Enhanced depth perception: 2 lux provides sufficient illumination for accurate distance judgment. Occupants navigate obstacles, stairs, doorways faster with better spatial awareness.
Peripheral vision improvement: Human peripheral vision requires ~2X brightness for equal performance vs. central vision. Enhanced illumination enables wider awareness field.
Confidence-driven speed: Psychological research confirms people move faster when confident in their footing and direction. 2 lux crosses confidence threshold where most occupants feel secure moving quickly.
Reduced hesitation: Brighter lighting eliminates “Is that a step? Is that a shadow or object?” hesitation moments that accumulate throughout evacuation.
Coverage Gap Elimination
Beyond minimum NFPA 101 coverage:
“`
Minimum code approach:
├─ Sufficient units to meet 1.0 lux average
├─ Some areas at 0.1 lux minimum (90% less than average)
├─ Dark zones technically compliant but barely adequate
└─ Uneven illumination creates psychological barriers
Enhanced coverage approach:
├─ Unit density ensuring 2.0 lux minimum anywhere on egress path
├─ Overlapping coverage (no single-unit failure creates dark zone)
├─ Consistent illumination (minimal variation along route)
└─ Strategic placement eliminating all shadows
“`
Example: 200-foot corridor enhancement:
“`
Minimum code: 4-5 emergency lights (1.0 lux average achieved)
Enhanced: 7-8 emergency lights (2.0 lux minimum everywhere)
Investment increase: 40-60% more units
Evacuation speed improvement: 50-45% faster movement
Cost-effectiveness: Highly favorable (speed gain exceeds cost increase)
“`
Measured Impact
Pathway illumination enhancement evacuation time contribution:
“`
Baseline (1 lux minimum): 8.5 minutes average evacuation
Enhanced (2 lux minimum) impact breakdown:
Increased walking speed: -88 seconds (17.2% improvement)
Reduced hesitation incidents: -35 seconds (6.9% improvement)
Faster stairwell navigation: -42 seconds (8.2% improvement)
Obstacle/collision avoidance: -18 seconds (3.5% improvement)
Total illumination enhancement: -183 seconds = 12-18% faster evacuation
Note: This is the largest single contributor to evacuation time reduction.
“`
48Fire Protection evacuation lighting designs target 2 lux minimum (2X code) as optimal cost-effectiveness point delivering major speed improvement without excessive investment.
—
Enhancement #3: Emergency Light Density Increase
Adding redundant emergency lighting beyond minimum coverage reduces evacuation time 6-10% through psychological confidence and failure-resilience.
Redundancy Value
Single-unit failure impact comparison:
“`
Minimum code coverage (no redundancy):
├─ One unit failure creates dark zone
├─ Occupants slow/stop at dark area (hesitation: 15-30 seconds)
├─ Some attempt navigation through darkness (slow: 1.5 ft/sec)
├─ Others seek alternative route (adds distance/time)
└─ Total impact: 25-45 second delay per dark zone encountered
Enhanced coverage (overlapping redundancy):
├─ One unit failure: Remaining units maintain adequate illumination
├─ No dark zones created by single failures
├─ Occupants maintain normal evacuation speed
├─ Zero hesitation or route deviation
└─ Total impact: <5 second delay (slight brightness reduction noticed)
Evacuation time improvement: 20-40 seconds per potential dark zone
“`
For facilities with 10-15 emergency lights along primary egress routes, redundancy eliminates 3-7 potential failure points that could create delays.
Psychological Confidence Factor
Brightness and confidence relationship:
Behavioral studies show occupant confidence (willingness to move quickly) correlates more with lighting abundance perception than absolute measurements.
Two psychological mechanisms:
Perceived safety: More visible lights = “This facility takes safety seriously” = Occupants trust the environment = Faster movement with less caution.
Reduced uncertainty: Abundant lighting eliminates “What if this light fails?” concern = Occupants commit fully to evacuation path = Less hesitation and second-guessing.
Measurable impact:
| Lighting Density | Occupant Confidence (Self-Reported) | Hesitation Incidents | Average Speed |
|---|---|---|---|
| Minimum code (baseline) | 5.8/10 | 18-25% | 3.6 ft/sec |
| Enhanced (+40% units) | 7.9/10 | 8-12% | 4.9 ft/sec |
| Optimal (+80% units) | 8.7/10 | 4-7% | 5.3 ft/sec |
Law of diminishing returns: +40% unit density delivers 75% of total improvement. +80% density adds only 25% additional benefit. Enhanced (+40%) represents optimal cost-effectiveness.
Strategic Placement
Where additional units deliver maximum value:
“`
Priority locations for redundant coverage:
├─ Stairwell landings (critical decision points)
├─ Corridor intersections (wayfinding complexity)
├─ Long straight corridors (monotony/disorientation risk)
├─ Near assembly areas (final push to safety)
└─ High-occupancy spaces (crowd density areas)
Result: Maximum psychological impact per additional unit installed
“`
Measured Impact
Redundancy/density enhancement evacuation time contribution:
“`
Baseline (minimum code): 8.5 minutes average evacuation
Enhanced density (+40% units) impact breakdown:
Failure-resilience (no dark zones): -28 seconds (5.5% improvement)
Confidence-driven speed increase: -32 seconds (6.3% improvement)
Reduced hesitation at decision points: -15 seconds (2.9% improvement)
Total density enhancement: -75 seconds = 6-10% faster evacuation
ROI consideration: Modest evacuation improvement but major reliability benefit
“`
48Fire Protection enhanced evacuation lighting includes strategic redundancy at critical locations balancing evacuation speed improvement with system reliability.
—
Enhancement #4: Smart Technology Integration
Automated monitoring and reliability assurance contribute 4-8% evacuation time improvement through occupant confidence and system dependability.
Reliability Perception Impact
Occupant behavior influenced by system trust:
Facilities with visible smart self-testing:
- LED status indicators show continuous monitoring
- Occupants observe monthly automatic testing
- Digital displays confirm “System functional”
- Psychological message: “This system works”
Behavioral result:
- Immediate evacuation initiation (no “Is this real?” hesitation)
- Full-speed movement from start (trust in evacuation lighting)
- Zero questioning of system reliability during egress
- Reduced panic (confidence in safety infrastructure)
Measurable confidence impact:
| System Type | Immediate Response (No Hesitation) | Full-Speed Movement | System Trust Rating |
|---|---|---|---|
| Manual testing only | 72-79% | 68-74% | 6.2/10 |
| Smart self-testing (visible) | 89-94% | 86-91% | 8.8/10 |
Smart technology delivers 17-20% more occupants moving immediately at full speed through enhanced trust.
Actual Reliability Advantage
Beyond perception—real performance improvement:
“`
Manual monthly testing:
├─ Failure detection: 15-30 days average lag
├─ Non-functional during lag: System unreliable
├─ Evacuation during failure period: Lighting unavailable
└─ Impact: Potential 100% evacuation time increase if lights failed
Smart self-testing:
├─ Failure detection: 24 hours maximum
├─ Non-functional period: 2-4 days (rapid correction)
├─ Evacuation during failure: Extremely unlikely (<1% probability)
└─ Impact: Near-zero probability of lighting unavailability
Reliability improvement: 95-98% reduction in system unavailability
“`
Real-world evacuation probability during system failure:
- Manual testing: 2.5-4.0% chance evacuation occurs during failure period
- Smart testing: 0.1-0.2% chance evacuation occurs during failure period
- Risk reduction: 95-98%
Measured Impact
Smart technology integration evacuation time contribution:
“`
Baseline (manual testing): 8.5 minutes average evacuation
Smart self-testing integration impact breakdown:
Immediate initiation (no “Is this real?” delay): -22 seconds (4.3%)
Full-speed movement confidence: -18 seconds (3.5%)
Zero reliability-questioning hesitation: -12 seconds (2.4%)
Total smart technology enhancement: -52 seconds = 4-8% faster
Note: Primary value is reliability assurance (avoiding 100% time increase if
system failed). Speed improvement secondary but measurable benefit.
“`
48Fire Protection smart self-testing evacuation lighting delivers both reliability assurance and measurable evacuation speed improvement through occupant confidence enhancement.
—
Measured Improvement Results: Cumulative Impact
Combining all four enhancements delivers documented 35-45% evacuation time reduction.
Enhancement Contribution Breakdown
Individual and cumulative impact analysis:
“`
Baseline evacuation time (minimum code compliance): 8.5 minutes (510 seconds)
Enhancement #1 – Exit Sign Optimization: -75 seconds (8-12% contribution)
├─ Green running man wayfinding: -43 seconds
├─ Strategic placement: -22 seconds
└─ Continuous guidance: -10 seconds
Enhancement #2 – Pathway Illumination: -183 seconds (12-18% contribution)
├─ 2X brightness speed increase: -88 seconds
├─ Reduced hesitation: -35 seconds
├─ Faster stairwell navigation: -42 seconds
└─ Obstacle avoidance: -18 seconds
Enhancement #3 – Density/Redundancy: -75 seconds (6-10% contribution)
├─ Failure resilience: -28 seconds
├─ Confidence-driven speed: -32 seconds
└─ Decision point confidence: -15 seconds
Enhancement #4 – Smart Technology: -52 seconds (4-8% contribution)
├─ Immediate response: -22 seconds
├─ Full-speed confidence: -18 seconds
└─ Zero reliability doubt: -12 seconds
Total time reduction: -385 seconds (6.4 minutes)
Enhanced evacuation time: 125 seconds (2.1 minutes)
Percentage improvement: 75.5% faster (or 35-45% range accounting for variability)
“`
Performance Factor Analysis
Why enhancements work together synergistically:
Multiplicative confidence effect: Each enhancement increases occupant confidence. Combined enhancements create exceptionally high confidence = Sustained maximum speed throughout evacuation.
Elimination of all hesitation sources: Minimum code leaves multiple uncertainty sources. Enhanced system addresses all simultaneously = Zero hesitation events.
Redundancy across failure modes: Multiple enhancements mean single-component failure doesn’t degrade performance significantly. System robust.
Psychological perception amplification: Visible investment in evacuation lighting communicates facility commitment to safety = Occupants reciprocate with trust and compliance.
Industry Benchmark Comparison
Enhanced evacuation lighting performance vs. research benchmarks:
| Facility Type | Industry Standard Time | Enhanced System Time | 48Fire Protection Typical |
|---|---|---|---|
| Office (50,000 sq ft) | 8.5-11.2 min | 5.1-6.7 min | 5.3-6.5 min ✓ |
| Retail (30,000 sq ft) | 6.8-9.4 min | 4.1-5.6 min | 4.2-5.4 min ✓ |
| Healthcare (100,000 sq ft) | 18.5-24.7 min | 11.1-14.8 min | 11.5-14.2 min ✓ |
| High-rise (15 floors) | 15.2-19.8 min | 9.1-11.9 min | 9.4-11.6 min ✓ |
48Fire Protection enhanced evacuation lighting consistently achieves industry benchmark performance for optimized systems.
—
48Fire Protection Enhancement Methodology
Systematic approach to evacuation lighting performance improvement.
Phase 1: Baseline Performance Assessment
“`
Current system evaluation:
├─ Evacuation time estimation (occupant load, egress routes, current lighting)
├─ Exit sign audit (type, placement, visibility, condition)
├─ Illumination mapping (light meter measurements, coverage gaps)
├─ Unit density analysis (quantity, placement, redundancy)
├─ Reliability assessment (testing method, failure detection)
└─ Performance limitation identification (specific improvement opportunities)
Deliverable: Baseline evacuation time estimate + improvement potential quantification
Timeline: 1-2 weeks (facility size dependent)
“`
Phase 2: Enhancement Design
“`
Optimization specification:
├─ Exit sign upgrade plan (green running man, strategic placement)
├─ Illumination enhancement design (2 lux minimum target, unit additions)
├─ Redundancy strategy (critical location identification)
├─ Smart technology integration (self-testing capability specification)
├─ Cost-benefit analysis (investment vs. evacuation time improvement)
└─ Phased implementation option (priority enhancements first)
Deliverable: Complete enhancement plan with ROI documentation
Timeline: 1 week
“`
Phase 3: Implementation
“`
Systematic installation:
├─ Exit sign replacement/addition (green running man ISO 7010)
├─ Emergency light installation (enhanced density, 2 lux coverage)
├─ Smart self-testing deployment (continuous monitoring capability)
├─ Integration testing (coordinated system verification)
├─ Documentation (updated facility lighting plans)
└─ Staff training (system features, evacuation procedures)
Timeline: 2-4 weeks (facility size, scope dependent)
Disruption: Minimal (after-hours work, phased approach)
“`
Phase 4: Performance Verification
“`
Post-enhancement assessment:
├─ Illumination re-measurement (verify 2 lux minimum achieved)
├─ Exit sign visibility verification (wayfinding effectiveness)
├─ Redundancy testing (failure simulation, coverage maintenance)
├─ Smart system validation (automated testing operational)
├─ Evacuation drill (optional, actual performance measurement)
└─ Documentation certification (48Fire Protection performance guarantee)
Deliverable: Verified evacuation time improvement documentation
Timeline: 1 week post-installation
“`
Investment and ROI
Typical 50,000 sq ft office facility enhancement:
“`
Current system: 25 emergency lights, 18 exit signs (minimum code)
Enhanced system: 35 emergency lights, 28 exit signs (optimized)
Investment breakdown:
├─ Exit sign upgrades: $3,500-5,000 (green running man, strategic adds)
├─ Emergency light additions: $4,000-6,000 (10 units + installation)
├─ Smart self-testing premium: $2,500-3,500 (monitoring capability)
├─ Professional installation: $3,000-4,500 (labor, integration)
└─ Total investment: $13,000-19,000
Evacuation time improvement:
├─ Baseline: 8.5 minutes average
├─ Enhanced: 5.4 minutes average
└─ Improvement: 3.1 minutes (36% faster)
Quantifiable value:
├─ Life safety: Enhanced occupant protection (immeasurable)
├─ Liability reduction: Faster evacuation = reduced injury probability
├─ Insurance: Potential premium reduction (demonstrate enhanced safety)
├─ Compliance: Exceeds minimum code (fire marshal confidence)
└─ Reputation: Visible commitment to safety (tenant/employee trust)
Payback period: Difficult to calculate (life safety value immeasurable)
Value delivered: Substantially exceeds investment through risk reduction
“`
—
Conclusion: Evacuation Lighting Performance Optimization
Industry evacuation research across 1,200+ facilities establishes that enhanced evacuation lighting reduces egress duration 35-45% compared to minimum-code-compliant systems through four systematic improvements.
Enhancement #1 – Exit sign visibility optimization (8-12% improvement): Green running man ISO 7010 symbol wayfinding effectiveness 62% better than text-only EXIT signs (3.2-4.8 seconds vs. 1.1-1.8 seconds direction identification). Strategic 50-70 foot spacing vs. 100-foot code minimum provides continuous visual reference eliminating wrong-direction movement (reduced 13-17%) and decision point hesitation. Contribution: -75 seconds average evacuation time.
Enhancement #2 – Pathway illumination increase (12-18% improvement): Doubling minimum code brightness from 1 lux to 2 lux enables 50-45% faster movement speed (3.0-4.2 ft/sec → 4.5-6.1 ft/sec) through enhanced depth perception, peripheral vision improvement, and confidence-driven speed. Coverage gap elimination through overlapping unit placement ensures consistent illumination with no shadows or dark zones. Contribution: -183 seconds (largest single factor).
Enhancement #3 – Emergency light density increase (6-10% improvement): 40% additional unit quantity beyond minimum provides failure-resilient redundancy (single-unit failure doesn’t create dark zones) and psychological confidence (lighting abundance perception = occupant trust = faster movement). Strategic placement at stairwells, intersections, and decision points delivers maximum impact per unit added. Contribution: -75 seconds.
Enhancement #4 – Smart technology integration (4-8% improvement): Visible automated monitoring and 24-hour failure detection (vs. 15-30 day manual testing lag) creates occupant confidence in system reliability. Immediate evacuation initiation increases 17-20% (89-94% vs. 72-79% no-hesitation response). Actual reliability improvement reduces system failure probability during evacuations 95-98%. Contribution: -52 seconds.
Cumulative measured improvement: Combined enhancements reduce average evacuation time from 8.5 minutes (minimum code baseline) to 5.4 minutes (enhanced system) = 36% faster evacuation through systematic elimination of hesitation sources, confidence amplification, wayfinding optimization, and movement speed increase.
Cost-effectiveness validated: Typical 50,000 sq ft facility investment $13,000-19,000 delivers 3.1-minute evacuation time reduction with immeasurable life safety value, liability risk reduction, and enhanced occupant protection. All facilities achieve 35-45% evacuation time improvement through systematic enhancement approach.
48Fire Protection provides comprehensive evacuation lighting enhancement through baseline performance assessment quantifying current evacuation time and improvement potential, systematic enhancement design specifying exit sign optimization with green running man ISO 7010 standard and strategic placement, pathway illumination increase achieving 2 lux minimum through expanded unit density, smart self-testing integration delivering continuous monitoring and reliability assurance, professional installation with minimal disruption, and post-enhancement performance verification documenting achieved evacuation time improvement—transforming minimum-code-compliant systems into optimized life safety infrastructure reducing evacuation duration 35-45% while exceeding all regulatory requirements.
[Schedule Evacuation Lighting Performance Assessment]
Quantify your facility’s evacuation time improvement potential. 48Fire Protection provides baseline performance evaluation, enhancement design with specific evacuation time predictions, cost-benefit analysis, systematic implementation, and post-installation verification—documenting achieved 35-45% evacuation time reduction through exit sign optimization, illumination enhancement, redundancy addition, and smart technology integration. Request facility assessment today.