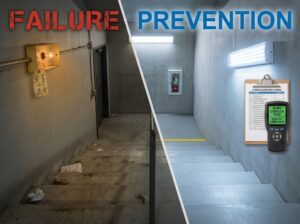
RESPONSE TIME EQUATION
Emergency fire response effectiveness measured in seconds:
“`
INCIDENT DETECTION
↓
+5-30 seconds (recognition delay)
↓
EQUIPMENT LOCATION
↓
+10-60 seconds (travel to extinguisher)
↓
EQUIPMENT RETRIEVAL
↓
+3-10 seconds (removal from bracket)
↓
OPERATIONAL READINESS
↓
+2-15 seconds (activation attempt)
↓
DISCHARGE BEGINS
↓
= TOTAL: 20-115 seconds potential delay
“`
Each second matters. Small fires double in size every 30-60 seconds.
Proper extinguisher service eliminates delays at three critical points:
- Equipment location (visibility, accessibility)
- Equipment retrieval (mounting, obstruction)
- Operational readiness (functionality, confidence)
This article examines how systematic service programs reduce emergency fire response time through equipment optimization, strategic placement, training support, and reliability assurance.
—
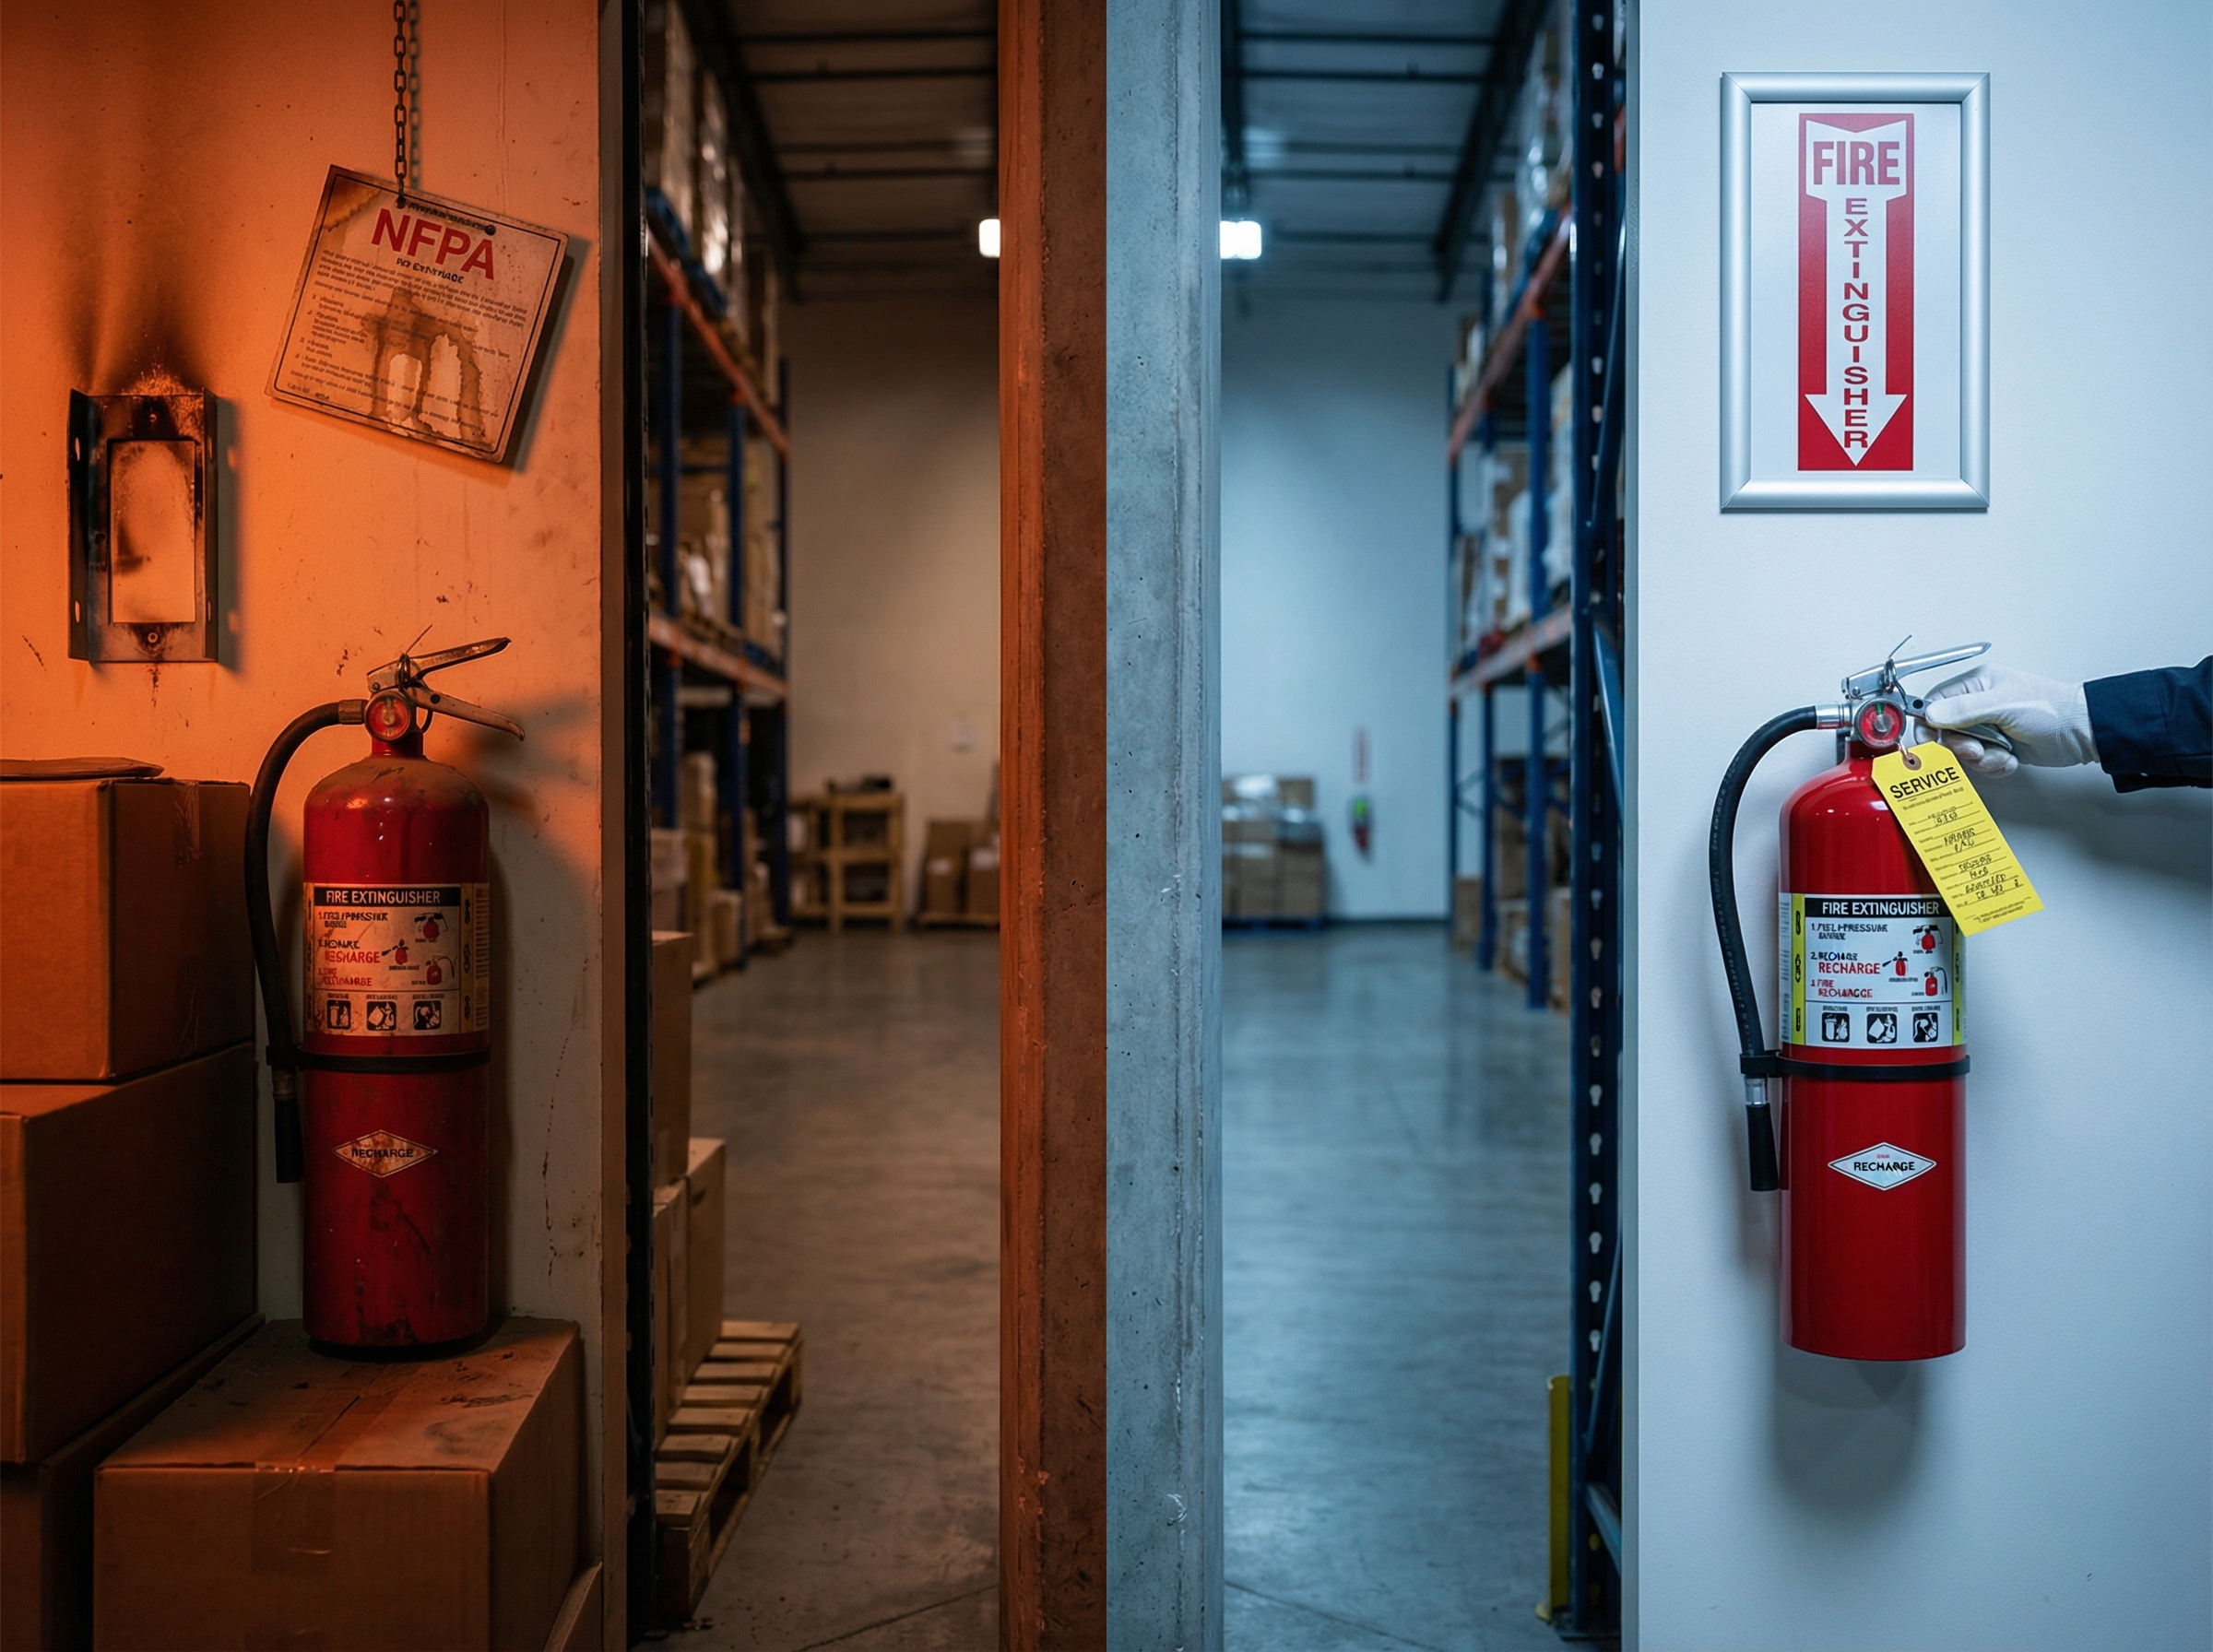
RESPONSE DELAY POINT 1 → EQUIPMENT LOCATION
How Service Improves “Time to Reach Extinguisher”
Average location time without service optimization: 30-60 seconds
With optimized placement through service: 10-20 seconds
Time saved: 20-40 seconds
—
Visibility Enhancement Through Service
SIGNAGE OPTIMIZATION
Monthly service visits provide opportunity for visibility verification:
“`
SERVICE INSPECTION INCLUDES:
├─ Signage presence confirmation
├─ Lighting adequacy assessment
├─ Sight line verification
├─ Obstruction identification
└─ Enhancement recommendations
“`
Service-driven improvements:
| Visibility Issue | Service Detection | Solution Implementation | Response Time Impact |
|---|---|---|---|
| Missing signage | Monthly inspection | Signage installed/replaced | -10 to -15 seconds |
| Poor lighting | Service visit observation | Lighting enhancement | -5 to -10 seconds |
| Visual obstruction | Systematic inspection | Obstruction removal | -8 to -12 seconds |
| Faded signage | Regular monitoring | Proactive replacement | -5 to -8 seconds |
48Fire monthly service includes systematic visibility assessment ensuring extinguishers locatable quickly during emergency fire response.
—
Consistency Pattern Development
Service creates predictable equipment locations:
WITHOUT SYSTEMATIC SERVICE:
- Equipment moved without documentation
- Locations change unpredictably
- No pattern for occupants to learn
- Each search begins from zero knowledge
WITH 48FIRE SERVICE:
- Location changes documented immediately
- Consistent placement patterns maintained
- Occupants develop mental map through repetition
- Reduced search time through familiarity
Emergency fire response benefit:
Personnel locate extinguishers automatically based on established patterns rather than active searching.
—
RESPONSE DELAY POINT 2 → EQUIPMENT RETRIEVAL
How Service Eliminates Access Barriers
Average retrieval time with obstructions: 15-45 seconds
With clear access through service: 3-8 seconds
Time saved: 12-37 seconds
—
Obstruction Prevention Through Monthly Inspections
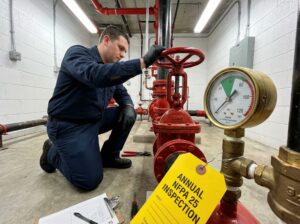
NFPA 10 Section 7.2.1.1 Criterion 2:
“No obstruction to access or visibility”
Service verification process:
“`
MONTHLY INSPECTION
↓
ACCESSIBILITY CHECK
↓
┌────────────────┐
│ OBSTRUCTED? │
└────────────────┘
↓ ↓
YES NO
↓ ↓
DOCUMENT CONFIRM
NOTIFY ACCESS
CORRECT CLEAR
↓
VERIFY
RESOLUTION
“`
Common obstructions identified during service:
- Temporarily placed equipment or materials
- Seasonal decorations blocking access
- Inventory storage encroaching on clearance
- Furniture repositioning creating barriers
- Maintenance equipment left in front
48Fire service response:
1. Obstruction documented with photo
2. Facility management notified immediately
3. Removal coordinated
4. Next inspection verifies sustained clearance
Emergency fire response advantage:
Systematic obstruction prevention ensures equipment accessible without delay during incident.
—
Mounting Security Verification
Service inspections include mounting integrity checks:
MOUNTING FAILURES THAT DELAY RETRIEVAL:
- Loose brackets requiring extra force to remove extinguisher
- Damaged mounting requiring careful extraction
- Improper mounting height forcing awkward retrieval
- Unstable mounting risking equipment drop
Service detection and correction:
| Mounting Issue | Detection During Service | Correction | Response Time Impact |
|---|---|---|---|
| Loose bracket | Monthly inspection physical check | Re-secure mounting | -3 to -5 seconds |
| Damaged bracket | Visual and physical examination | Bracket replacement | -5 to -8 seconds |
| Improper height | Height verification | Remount at proper height | -2 to -4 seconds |
| Wall degradation | Structural assessment | Reinforcement/relocation | -5 to -10 seconds |
Secure, properly installed mounting enables:
- Single-motion removal
- No fumbling with bracket
- Confident extraction
- Immediate deployment capability
—
RESPONSE DELAY POINT 3 → OPERATIONAL READINESS
How Service Ensures Immediate Functionality
Average activation delay with equipment issues: 10-30 seconds (or complete failure)
With serviced equipment: 2-5 seconds
Time saved: 8-25 seconds (plus prevention of complete failure)
—
Pressure Verification Through Service
PRESSURE = IMMEDIATE DISCHARGE CAPABILITY
Monthly inspection verifies:
“`
PRESSURE GAUGE CHECK
↓
┌───────────────────┐
│ IN GREEN ZONE? │
└───────────────────┘
↓ ↓
YES NO
↓ ↓
CONFIRMED REMOVE
READY FOR SERVICE
RECHARGE
RETURN
“`
Emergency fire response impact of pressure verification:
Equipment with proper pressure:
- Pull pin → immediate discharge
- No delay, no uncertainty
- Full suppression capability available
Equipment with low/no pressure (undetected without service):
- Pull pin → no discharge or weak stream
- 10-30 seconds lost attempting to operate
- Personnel must retreat, locate alternate equipment
- Fire grows significantly during delay
- Incident escalates beyond portable extinguisher capability
48Fire monthly service identifies pressure issues before emergency fire response needed, preventing complete operational failure.
—
Seal Integrity Verification
INTACT SEALS = NO PREVIOUS DISCHARGE
Monthly inspection confirms:
□ Pin present and secure
□ Tamper seal unbroken
□ No evidence of previous activation
□ Equipment holds pressure
Emergency fire response confidence:
With verified seal integrity:
Personnel know equipment fully charged, never partially discharged, ready for complete use.
Without service verification:
Risk of discovering during emergency that equipment previously discharged, partially empty, or non-functional.
Response time impact:
Confidence in equipment eliminates hesitation, enables immediate deployment without second-guessing functionality.
—
Component Condition Through Annual Maintenance
48Fire annual maintenance ensures all operational components function properly:
COMPONENTS AFFECTING RESPONSE TIME:
Discharge mechanism:
- Valve operation smooth (not seized)
- Lever springs back (not stuck)
- Mechanism activates easily (not corroded)
- Discharge immediate upon activation
Hose and nozzle (applicable types):
- Hose flexible (not stiff or cracked)
- Nozzle clear (not clogged)
- Connection secure (not loose)
- Discharge pattern effective
Agent condition:
- Proper agent present
- Not contaminated
- Not settled/caked
- Free-flowing discharge
Emergency fire response benefit:
All components function as designed during emergency, no mechanical failures causing delays or complete malfunction.
—
RESPONSE ACCELERATION FACTOR 4 → PERSONNEL CONFIDENCE
How Service Enables Decisive Action
Confident personnel response: 5-10 seconds decision time
Uncertain personnel response: 15-45 seconds (or evacuation without attempt)
Time difference: 10-35 seconds plus potential suppression success
—
Visible Maintenance Builds Trust
Psychology of confidence:
Personnel observe:
- Regular monthly inspection activity
- Current service tags on equipment
- Professional 48Fire technicians servicing equipment
- Systematic attention to fire safety
Psychological impact:
- Equipment perceived as reliable
- Confidence in functionality
- Increased willingness to attempt suppression
- Reduced hesitation during incident
Emergency fire response research indicates:
Visible, systematic maintenance correlates with higher personnel engagement rates during incipient fire incidents.
Time impact:
Confident personnel act decisively rather than hesitating, debating, or immediately evacuating without suppression attempt.
—
Training Integration Through Service
Service visits provide training opportunities:
48Fire technician interactions educate personnel:
- Equipment location familiarization
- Operational instruction visibility
- PASS technique discussion (Pull, Aim, Squeeze, Sweep)
- Appropriate use scenarios
- When to evacuate vs. suppress
Training effectiveness enhancement:
- Formal training reinforced by regular service presence
- Equipment familiarity through repeated observation
- Questions answered during service visits
- Confidence built through professional interaction
Emergency fire response advantage:
Trained, confident personnel make rapid suppression decisions rather than defaulting to evacuation, potentially controlling fires before escalation.
—
RESPONSE ACCELERATION FACTOR 5 → STRATEGIC PLACEMENT
How Service Optimizes Equipment Distribution
Standard placement response time: 45-75 seconds average
Optimized placement through service assessment: 20-35 seconds average
Time saved: 25-40 seconds
—
Travel Distance Optimization
Service assessment identifies coverage gaps:
48Fire placement analysis during service:
“`
SERVICE VISIT
↓
FACILITY WALKTHROUGH
↓
TRAVEL DISTANCE MEASUREMENT
↓
┌─────────────────┐
│ WITHIN CODE │
│ REQUIREMENTS? │
└─────────────────┘
↓ ↓
YES NO
↓ ↓
ASSESS RECOMMEND
FOR ADDITIONAL
OPTIMIZATION EQUIPMENT
↓
HAZARD PROXIMITY
ANALYSIS
↓
EGRESS ALIGNMENT
VERIFICATION
“`
Code compliance vs. response optimization:
| Approach | Travel Distance | Response Time | Emergency Fire Response |
|---|---|---|---|
| Code minimum | 75 feet maximum (Class A) | 35-60 seconds | Adequate |
| Service optimized | 50 feet target | 20-35 seconds | Superior |
| Strategic placement | Hazard-adjacent | 10-20 seconds | Optimal |
48Fire service recommendations optimize placement beyond code minimums for faster emergency fire response.
—
Hazard-Specific Positioning
Service identifies high-risk areas requiring priority placement:
PRIORITY PLACEMENT ZONES:
Kitchen areas:
- Equipment immediately adjacent to cooking equipment
- Accessible without entering hazard zone
- Response time: 5-10 seconds
Electrical rooms:
- Equipment outside room but immediately accessible
- Positioned for safe approach
- Response time: 8-15 seconds
Chemical storage:
- Multiple equipment types available
- Upwind positioning considered
- Response time: 10-20 seconds
Manufacturing equipment:
- Positioned near high-heat processes
- Operator-accessible locations
- Response time: 8-15 seconds
Emergency fire response benefit:
Strategic positioning reduces response time at highest-risk locations where incidents most likely.
—
RESPONSE ACCELERATION FACTOR 6 → DEFICIENCY ELIMINATION
How Service Prevents Response Failures
Equipment failure during emergency: Complete response failure + evacuation
Service-maintained equipment: <2% failure rate
Success difference: Potential incident control vs. guaranteed escalation
—
Early Problem Detection
Monthly service identifies developing issues before emergency:
PROGRESSIVE FAILURE PREVENTION:
“`
MONTH 1: Slight pressure decline detected
↓
SERVICE RESPONSE: Monitoring flagged
↓
MONTH 2: Pressure continues declining
↓
SERVICE RESPONSE: Equipment removed, recharged
↓
RESULT: Failure prevented before emergency fire response needed
“`
Issues detected through systematic service:
- Slow pressure loss (detected within 30 days)
- Early corrosion (treated before structural compromise)
- Component wear (replaced before failure)
- Seal degradation (addressed before breach)
- Mounting deterioration (reinforced before failure)
Emergency fire response protection:
Problems corrected during routine service rather than discovered during emergency when consequences critical.
—
Immediate Deficiency Response
Critical issues trigger emergency action:
48Fire CRITICAL DEFICIENCY PROTOCOL:
“`
CRITICAL ISSUE IDENTIFIED
(no pressure, severe damage, missing equipment)
↓
IMMEDIATE ACTIONS:
├─ Equipment tagged OUT OF SERVICE
├─ Removed from bracket
├─ Temporary replacement installed
├─ Management notified
└─ Emergency service scheduled
↓
RESULT: Protection maintained continuously
NO GAP IN EMERGENCY FIRE RESPONSE CAPABILITY
“`
Response time protection:
Temporary equipment ensures no period without fire suppression capability, maintaining consistent response time potential.
—
RESPONSE TIME MEASUREMENT
Quantifying Service Impact on Emergency Fire Response
Comparative analysis of response time components:
—
Time-to-Suppression Comparison
SCENARIO: Incipient fire in commercial facility
WITHOUT SYSTEMATIC SERVICE:
“`
Detection: 10 seconds
↓
Equipment location: 45 seconds (poor visibility, unfamiliar placement)
↓
Travel: 30 seconds
↓
Retrieval: 20 seconds (obstruction present)
↓
Activation attempt: 15 seconds (equipment fails – no pressure)
↓
Retreat and locate alternate: 60 seconds
↓
Second suppression attempt: 10 seconds
↓
TOTAL: 190 seconds (3 minutes, 10 seconds)
FIRE STATUS: Likely beyond portable extinguisher capability
“`
—
WITH 48FIRE SERVICE:
“`
Detection: 10 seconds
↓
Equipment location: 15 seconds (clear signage, known location pattern)
↓
Travel: 15 seconds (optimized placement)
↓
Retrieval: 5 seconds (clear access, secure mounting)
↓
Activation: 3 seconds (verified functionality, personnel confidence)
↓
Suppression begins: 2 seconds
↓
TOTAL: 50 seconds
FIRE STATUS: Controlled during incipient phase
“`
TIME SAVED: 140 seconds (2 minutes, 20 seconds)
Emergency fire response outcome difference:
- Without service: Fire escalates, requires fire department
- With service: Fire controlled, incident contained
—
Statistical Impact Analysis
Fire growth during response delays:
| Time Elapsed | Fire Size (relative) | Suppression Method |
|---|---|---|
| 30 seconds | 1× (baseline) | Portable extinguisher effective |
| 60 seconds | 2-4× | Portable extinguisher marginal |
| 90 seconds | 4-8× | Beyond portable capability |
| 120 seconds | 8-16× | Requires hose line |
| 180 seconds | 16-32× | Significant fire department response |
Service impact on timeline:
Reducing response time from 190 seconds to 50 seconds changes incident from requiring fire department response to successful occupant control.
Emergency fire response success correlation:
Facilities with systematic service demonstrate higher incident control rates and lower fire department response requirements.
—
CONTINUOUS RESPONSE READINESS
How Service Maintains Optimal Emergency Fire Response Capability
Service creates sustained readiness rather than point-in-time compliance.
—
Monthly Verification Cycle
CONTINUOUS READINESS ASSURANCE:
“`
MONTH 1: Inspection → All equipment verified functional
↓ (30 days)
MONTH 2: Inspection → Changes detected, addressed
↓ (30 days)
MONTH 3: Inspection → Sustained readiness confirmed
↓ (30 days)
[PATTERN CONTINUES]
“`
Emergency fire response benefit:
Equipment functionality known within 30 days maximum, versus unknown status between annual checks.
Readiness confidence:
- Current month inspection completed: HIGH
- 2-3 months since inspection: MODERATE
- 6+ months since inspection: LOW
- 12+ months since inspection: UNCERTAIN
48Fire monthly service maintains HIGH readiness confidence continuously.
—
Automated Reminder Systems
Service programs include deadline management:
“`
48FIRE AUTOMATED SYSTEM
↓
Inspection due date approaching
↓
Advance notification sent (7 days)
↓
Service scheduled automatically
↓
Inspection performed on schedule
↓
Next inspection auto-scheduled
↓
ZERO GAPS IN VERIFICATION
“`
Emergency fire response advantage:
No periods of unknown equipment status, continuous verification maintains response capability.
—
IMPLEMENTATION STRATEGIES
Building Emergency Fire Response Through Service
48Fire systematic approach to response time optimization:
—
Phase 1: Baseline Assessment
Initial service visit includes:
□ Complete equipment inventory
□ Placement analysis and optimization recommendations
□ Visibility assessment
□ Accessibility verification
□ Functional testing
□ Documentation establishment
Establishes baseline emergency fire response capability.
—
Phase 2: Systematic Improvement
Ongoing service implements:
□ Placement optimization (equipment additions/relocations)
□ Visibility enhancement (signage, lighting)
□ Accessibility maintenance (obstruction prevention)
□ Functional reliability (monthly verification, annual service)
□ Personnel confidence (training support, visible maintenance)
Progressively improves emergency fire response time.
—
Phase 3: Sustained Excellence
Continuous service maintains:
□ Optimized placement sustained
□ Equipment functionality verified monthly
□ Accessibility preserved through systematic checks
□ Personnel confidence maintained through visible service
□ Response capability measured and documented
Ensures emergency fire response capability sustained long-term.
—
CONCLUSION
Service Impact on Emergency Fire Response Time
Systematic extinguisher service reduces emergency fire response time through:
Equipment Location Optimization:
- Enhanced visibility (signage, lighting, sight lines)
- Consistent placement patterns
- Time reduction: 20-40 seconds
Retrieval Barrier Elimination:
- Obstruction prevention
- Secure mounting maintenance
- Time reduction: 12-37 seconds
Operational Readiness Assurance:
- Pressure verification monthly
- Component functionality through annual service
- Seal integrity confirmation
- Time reduction: 8-25 seconds (plus failure prevention)
Personnel Confidence Building:
- Visible systematic maintenance
- Training integration opportunities
- Decisive action enablement
- Time reduction: 10-35 seconds
Strategic Placement Enhancement:
- Travel distance optimization
- Hazard-specific positioning
- Time reduction: 25-40 seconds
Deficiency Elimination:
- Early problem detection
- Immediate critical issue response
- Complete failure prevention
- Success rate improvement: Measurable incident control increase
Total potential response time improvement: 75-177 seconds
Emergency fire response outcome transformation:
Incidents controlled during incipient phase versus escalation requiring fire department response.
48Fire emergency fire response optimization services provide monthly inspections, annual maintenance, strategic placement consultation, visibility enhancement, deficiency management, and personnel confidence support—delivering measurable response time reduction through systematic service excellence.
[Optimize Emergency Fire Response Capability]
—
48Fire
Emergency Fire Response Optimization
Response Time Reduction • Systematic Service • Continuous Readiness
Contact: [/contact-us]